Today’s market session has seen bears in control of markets as seen from the drop in the global market cap. The total cap stood at $2.34T as of press time representing a 2.27% decrease over the last 24 hours. On the other hand, the trading volume pumped by 95.9% over the same period to stand at $97.2B.
Bitcoin Price Review
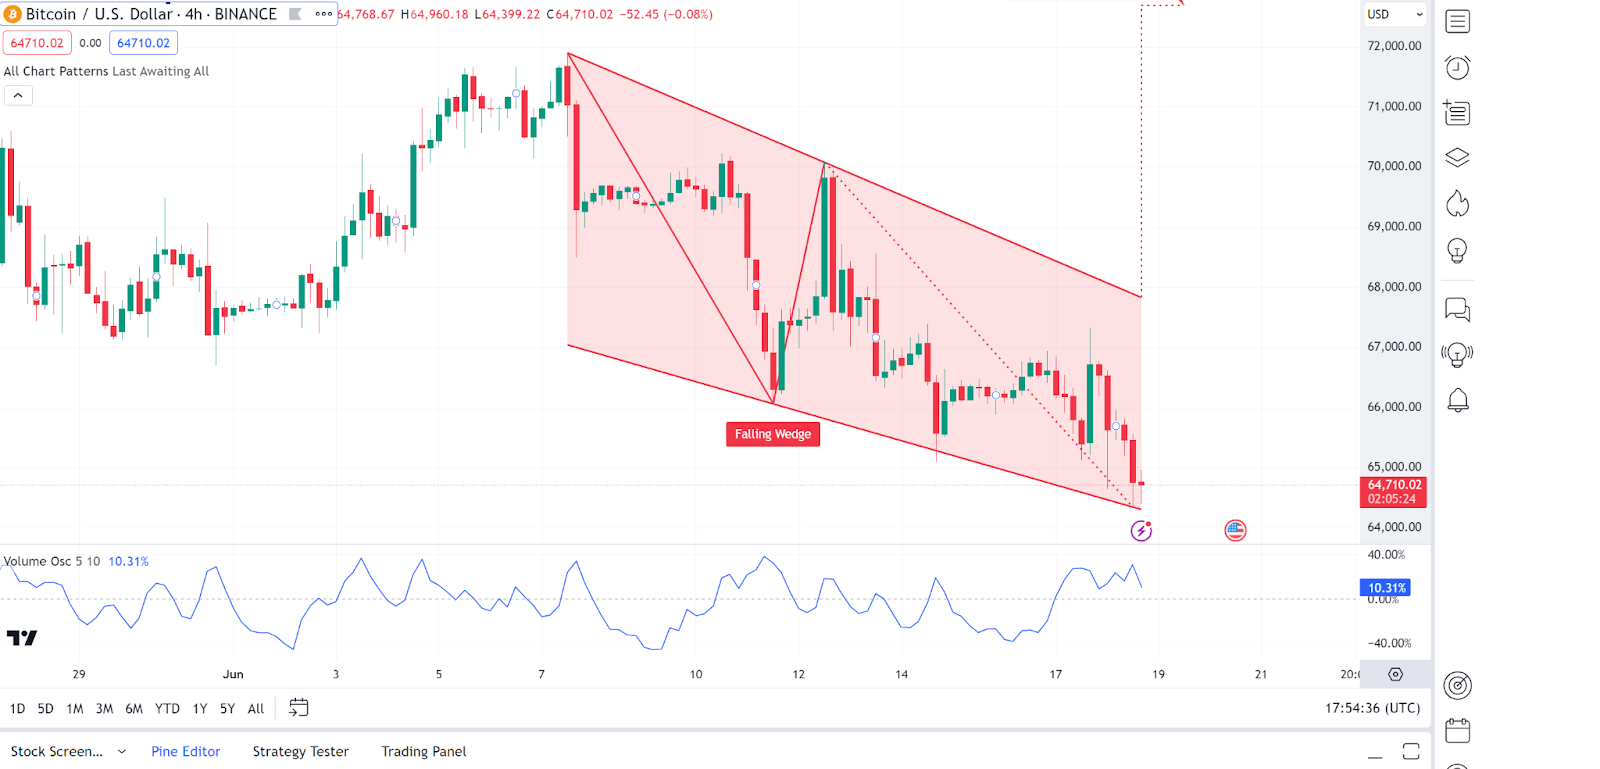
Bitcoin (BTC) is among the top loosers in today’s session as seen from its price movements. Looking at an in-depth analysis we see a falling wedge pattern, typically a bullish reversal pattern. A breakout above the upper trendline could signal a bullish reversal. Current Bitcoin price action near the lower trendline suggests a potential breakout scenario.
On the other hand, the volume oscillator is at 10.31%, indicating moderate volume levels. An increase in volume could confirm a breakout. As of press time, Bitcoin was trading at $64,568, representing a 3.36% decrease over the the last 24 hours.
Ethereum Price Review
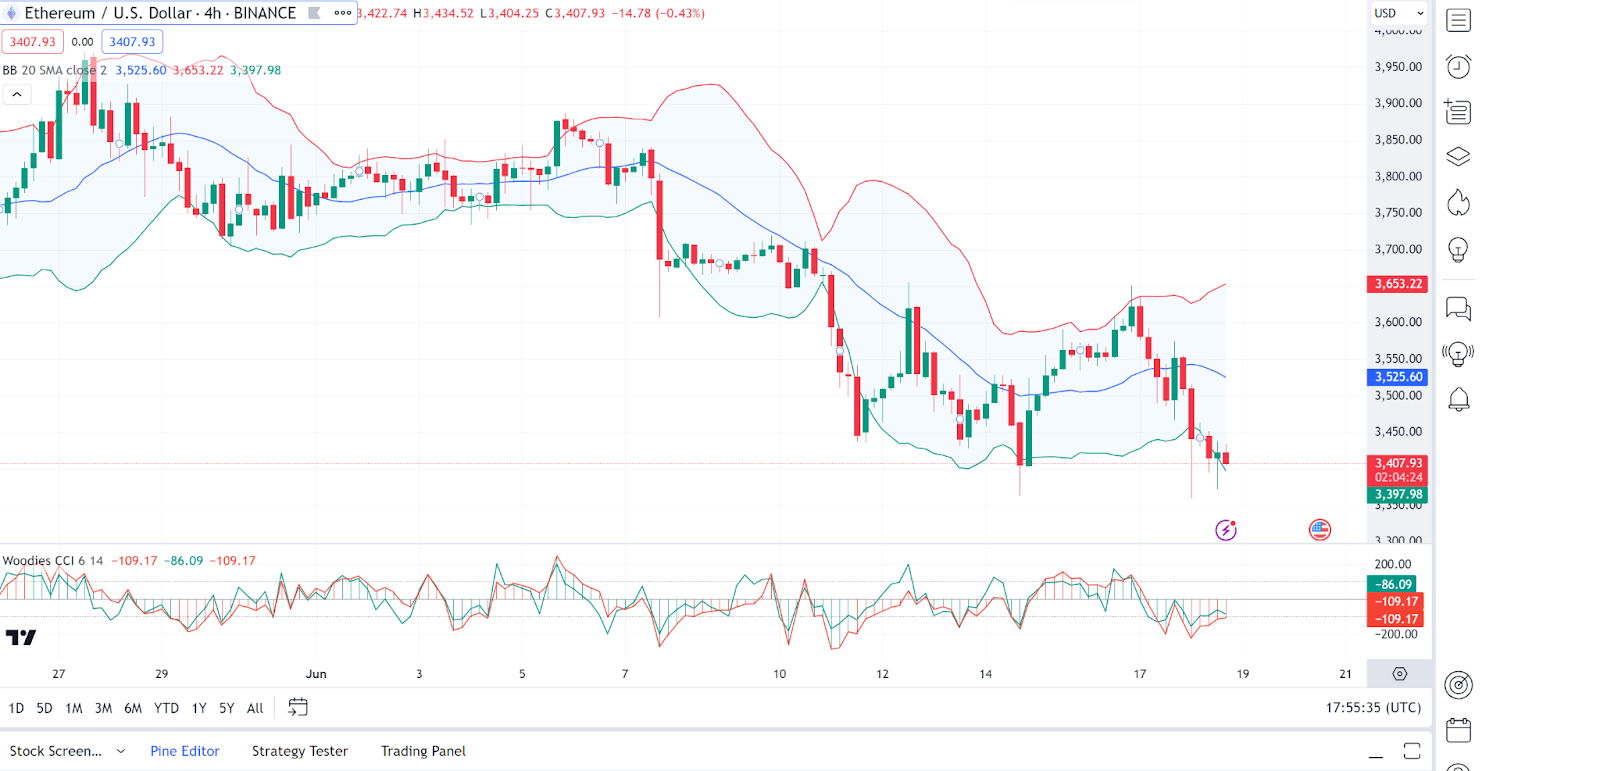
Ethereum (ETH) has also failed to post gains in today’s session as seen from its price movements. Looking at an in-depth analysis, we see that the Bollinger Bands indicate high volatility with widening bands. The Ethereum price is moving towards the lower band, suggesting a bearish trend. The 20 SMA is currently above the price, reinforcing the bearish sentiment.
On the other hand, the Woodies CCI is below -100, indicating a strong bearish trend and possible oversold conditions. If the CCI rises above -100, it could signal a potential buying opportunity. As of press time, Ethereum was trading at $3,414, representing a 4.2% decrease over the the last 24 hours.
Notcoin Price Review
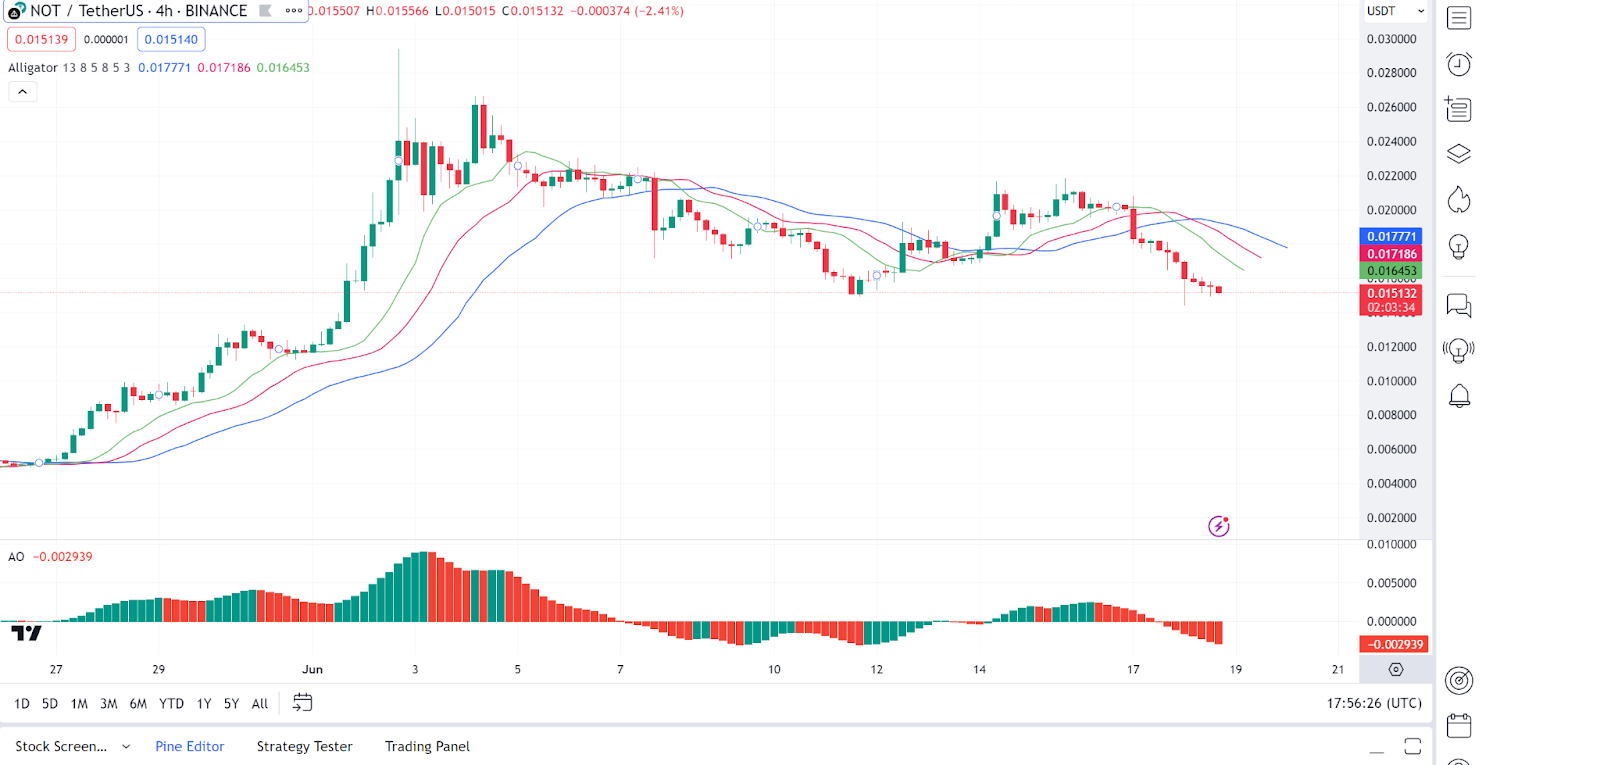
Notcoin (NOT) is also another looser in today’s session as seen from its price movements. Looking at an in-deph analysis, we see that the Alligator’s lines are widening, indicating a trend formation. The Notcoin price is currently below the red line, suggesting a bearish trend. The green and blue lines are converging, indicating a potential change in trend direction.
On the other hand, the Awesome Oscillator (AO) is negative, suggesting bearish momentum. A cross above the zero line would indicate a shift to bullish momentum. As of press time, Notcoin was trading at $0.01515, representing a 15.6% decrease over the the last 24 hours.
Ripple Price Review
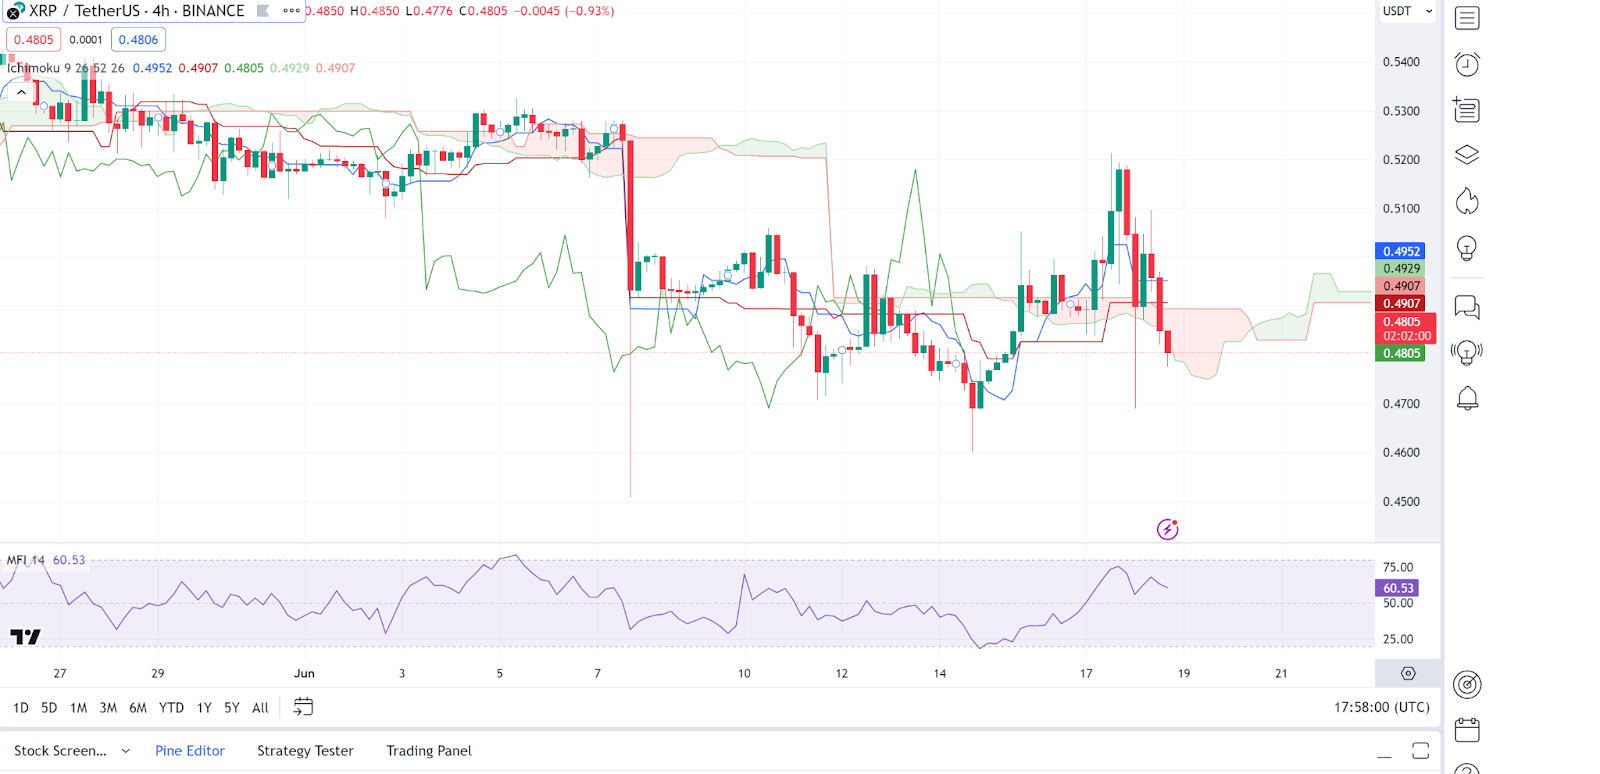
Ripple (XRP) is also facing a bear session today as seen from its price movements. Looking at an in-depth analysis, we see that the Ripple price is below the cloud, indicating a bearish trend. The cloud ahead is red, suggesting continued bearish sentiment. The conversion line is below the base line, reinforcing the bearish trend.
On the other hand, the Money Flow Index (MFI) is at 60.53, suggesting the price is in the neutral zone. A move above 80 would indicate overbought conditions, while below 20 would suggest oversold conditions. As of press time, Ripple was trading at $0.4821, representing a 6.15% decrease over the the last 24 hours.
Cardano Price Review
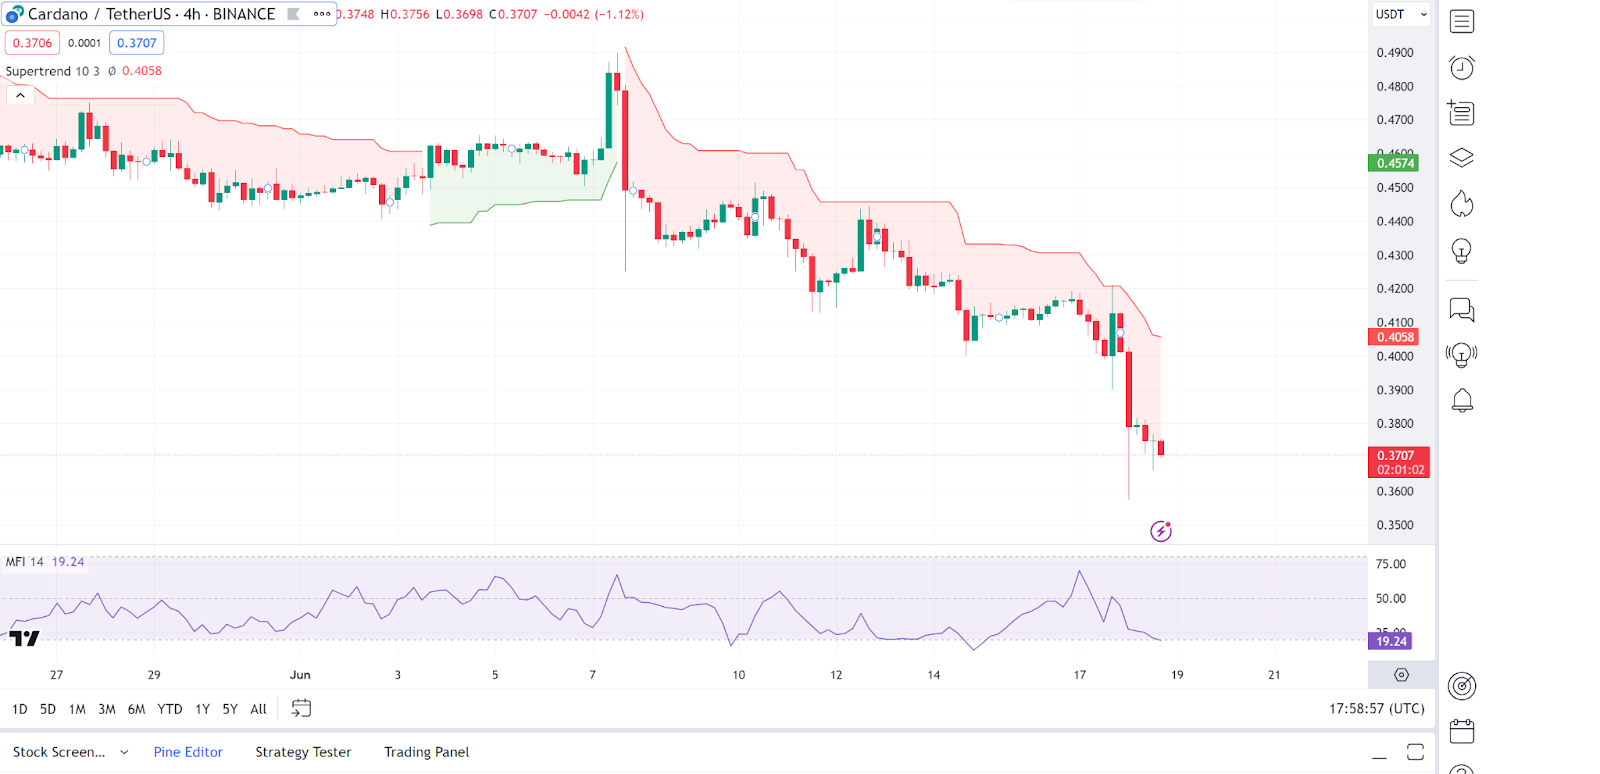
Cardano (ADA) is also a top looser today as seen from its price movements. Looking at an in-depth analysis we see that the Supertrend indicator is red, indicating a bearish trend. The Cardano price is below the indicator, confirming the bearish sentiment.
On the flip side, the Money Flow Index (MFI) is at 19.24, indicating oversold conditions. A potential reversal could be on the horizon if buying pressure increases. As of press time, Cardano was trading at $0.3721, representing a 9.8% decrease over the the last 24 hours.
