In the fast-paced world of cryptocurrencies, traders and investors are closely monitoring the price movements of major digital assets like Bitcoin (BTC), Ethereum (ETH), BNB, XRP, Dogecoin (DOGE), Cardano (ADA), and Solana (SOL). Amidst market uncertainties and macroeconomic factors, the prices of these cryptocurrencies have been displaying signs of indecision.
In this article, we will analyze the recent price actions and key levels to watch for each of these cryptocurrencies, shedding light on potential scenarios for the near future. From potential breakout points to critical support levels, traders are on the lookout for crucial insights that may influence their trading strategies. Let’s delve into the price analysis of these prominent cryptocurrencies to uncover the possible trends that lie ahead.
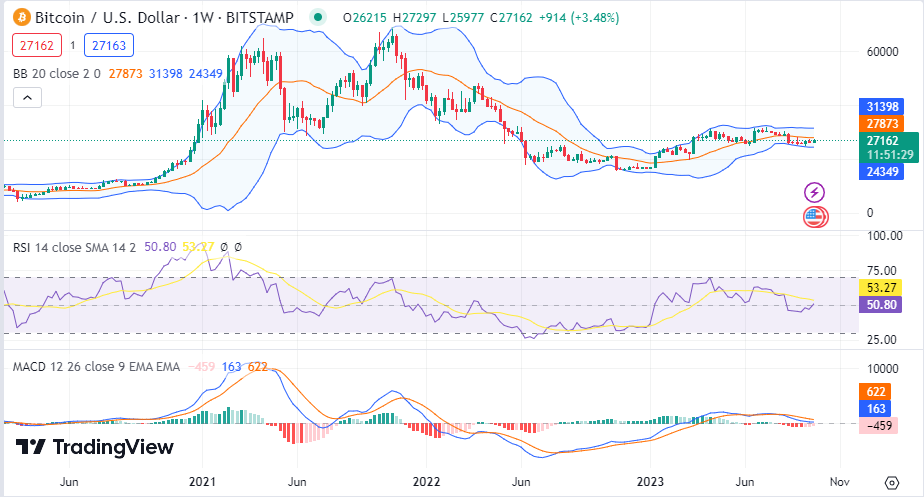
Bitcoin (BTC) Price Analysis
Bitcoin (BTC) is currently trading at $28,914, which is 0.90% down in the last 24 hours. The price action shows signs of indecision as traders weigh market sentiment and macroeconomic factors. Bitcoin’s current price is caught in a tight range between the 20-day exponential moving average (EMA) at $29,523 and a horizontal support level at $28,861. The downward slope of the 20-day EMA and the negative relative strength index (RSI) suggest that bears have a slight advantage in the market.
A sustained drop below $28,861 could lead the BTC price to tumble further, targeting $27,500 and potentially even $26,000. However, if the price manages to rebound from the $28,861 support level, it will demonstrate the bulls’ strong defense at this point. A convincing break and close above $30,000 would indicate a potential resurgence of bullish momentum. In such a scenario, the Bitcoin price may rally toward the overhead resistance zone, which lies in the range of $31,804 to $32,400.
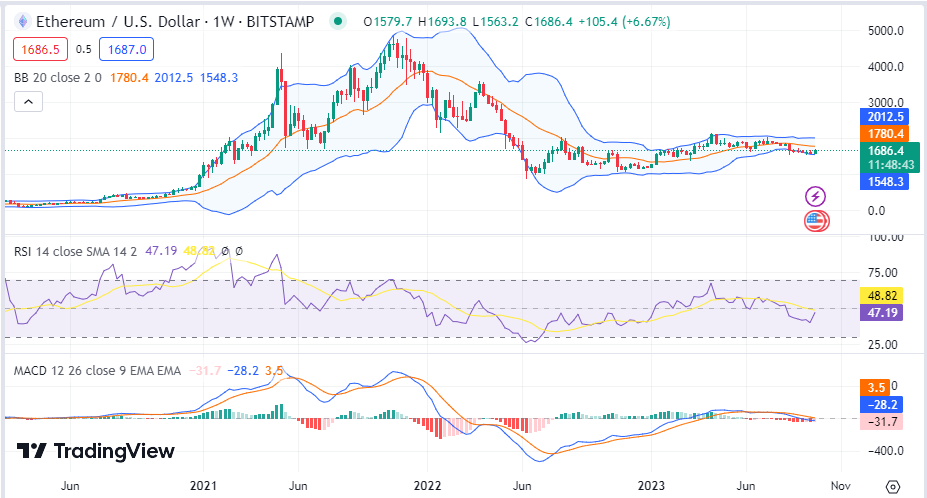
Ethereum (ETH) Price Analysis
Ethereum (ETH) is currently trading at $1,821, which is 0.96% down in the last 24 hours. Ethereum has been closely following the price movements of Bitcoin, as it remains the second-largest cryptocurrency by market capitalization. The recent market volatility has impacted ETH, leading to a period of consolidation.
The immediate support for Ethereum is at $1,800, and a break below this level might trigger further downside toward the $1,700 support. On the upside, the first resistance lies at $1,900, followed by the crucial psychological level of $2,000. A bullish breakout above $2,000 could pave the way for a potential rally toward the next resistance at $2,200.
BNB Price Analysis
BNB is currently trading at $240.5, which is 0.05% down in the last 24 hours. On August 2, BNB experienced rejection at the resistance line of a symmetrical triangle pattern, indicating strong resistance from the bears at that level. At present, both moving averages have flattened, and the RSI is close to the midpoint, signaling a balance between supply and demand. The current equilibrium could shift in favor of the bulls if the price successfully surges above the triangle.
In such a scenario, the BNB price might attempt a rally toward $265, where the bears are likely to present another formidable challenge. However, a different outcome may unfold if the price turns downward and breaks below the triangle pattern. Such a move would signal a dominant position of the bears. Subsequently, the pair could retest the critical support level at $220. If this support level fails to hold, it could lead to the beginning of the next leg of the downtrend.
XRP Price Analysis
XRP is currently trading at $0.6359, which is 3.01% down in the last 24 hours. XRP has faced selling pressure, contributing to its decline over the past 24 hours. On August 3, XRP experienced a significant decline below the 20-day EMA at $0.68, followed by another slide on August 4. Consequently, the price breached the crucial support level at $0.67.
The bulls are now likely to defend the 61.8% Fibonacci retracement level, marked at $0.64. A breakdown below this level could lead the XRP price to plummet toward the breakout level of $0.56. While the 50-day simple moving average (SMA) at $0.59 may offer temporary support, it is anticipated that it might not hold. On the contrary, if the bulls manage to push the price back above the 20-day EMA, it would indicate substantial demand at lower price levels. This would increase the probability of the XRP price remaining within the range of $0.67 to $0.85 for a while longer.
Dogecoin (DOGE) Price Analysis
Dogecoin (DOGE) is currently trading at $0.0729, which is 1.26% down in the last 24 hours. DOGE has faced moderate selling pressure but has managed to hold above its immediate support level. As of this writing, the bulls are making an effort to drive the price back above the 20-day EMA. If they succeed in doing so, it could lead the DOGE price to rise toward the downtrend line. However, this level is expected to prompt selling pressure from the bears.
A reversal from the downtrend line would indicate a negative shift in the trend, suggesting that relief rallies are being sold. Subsequently, the bears would likely attempt to push the price below the 20-day EMA once again, with the aim of challenging the breakout level at $0.07. The immediate support for DOGE is at $0.07, and a break below this level might extend the downside toward $0.065. However, a strong bullish move above $0.085 could pave the way for a potential rally toward $0.09 and beyond.
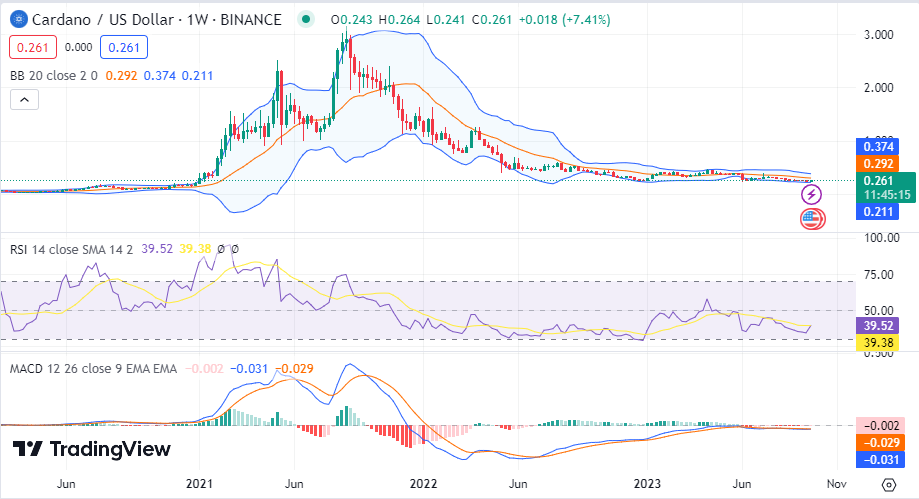
Cardano (ADA) Price Analysis
Cardano (ADA) is currently trading at $0.291, which is 0.64% down in the last 24 hours. Yesterday, ADA experienced a break below the 20-day EMA at $0.30, followed by a breach of the 50-day SMA at the same level today. This indicates an attempt by the bears to take control of the market sentiment. If the price continues to stay below the uptrend line, selling pressure may intensify, potentially causing the ADA price to decline further to $0.26 and then to the critical support level at $0.24.
At this point, the buyers are expected to defend this level vigorously. However, for the bulls to stage a comeback, they must act swiftly to push the price above both the moving averages and the overhead resistance at $0.32. In such a scenario, the ADA price could advance toward $0.34 and eventually aim for $0.38.
Solana (SOL) Price Analysis
Solana (SOL) is currently trading at $22.71, which is 0.05% down in the last 24 hours. The immediate support for SOL is at $22.00, and a break below this level might lead to further downside toward $20.00. On the upside, the first resistance lies at $25.00, followed by the crucial level of $28.00. A bullish breakout above $28.00 could signal a potential rally toward $30.00 and beyond.
As per its daily chart, if the SOL price manages to surpass the 20-day EMA at $23.84, it would indicate the potential for further gains, with possible targets at $25.68 and subsequently $27.12. These levels are crucial resistance points to monitor, as a successful breakthrough could signal the beginning of a new uptrend.