


- 1. The floor Coinbase drew on Nov. 13 is now the price
- 2. Seven sessions, $1.91 billion, and eleven straight IBIT redemptions
- 3. What $1,000 buys at 07:55 UTC
- 4. The funding that never reset
- 5. Stablecoins shrank faster than they did after TerraUSD
- 6. The dates that decide the next $1,000
- 7. Where this read breaks
- 8. Frequently Asked Questions
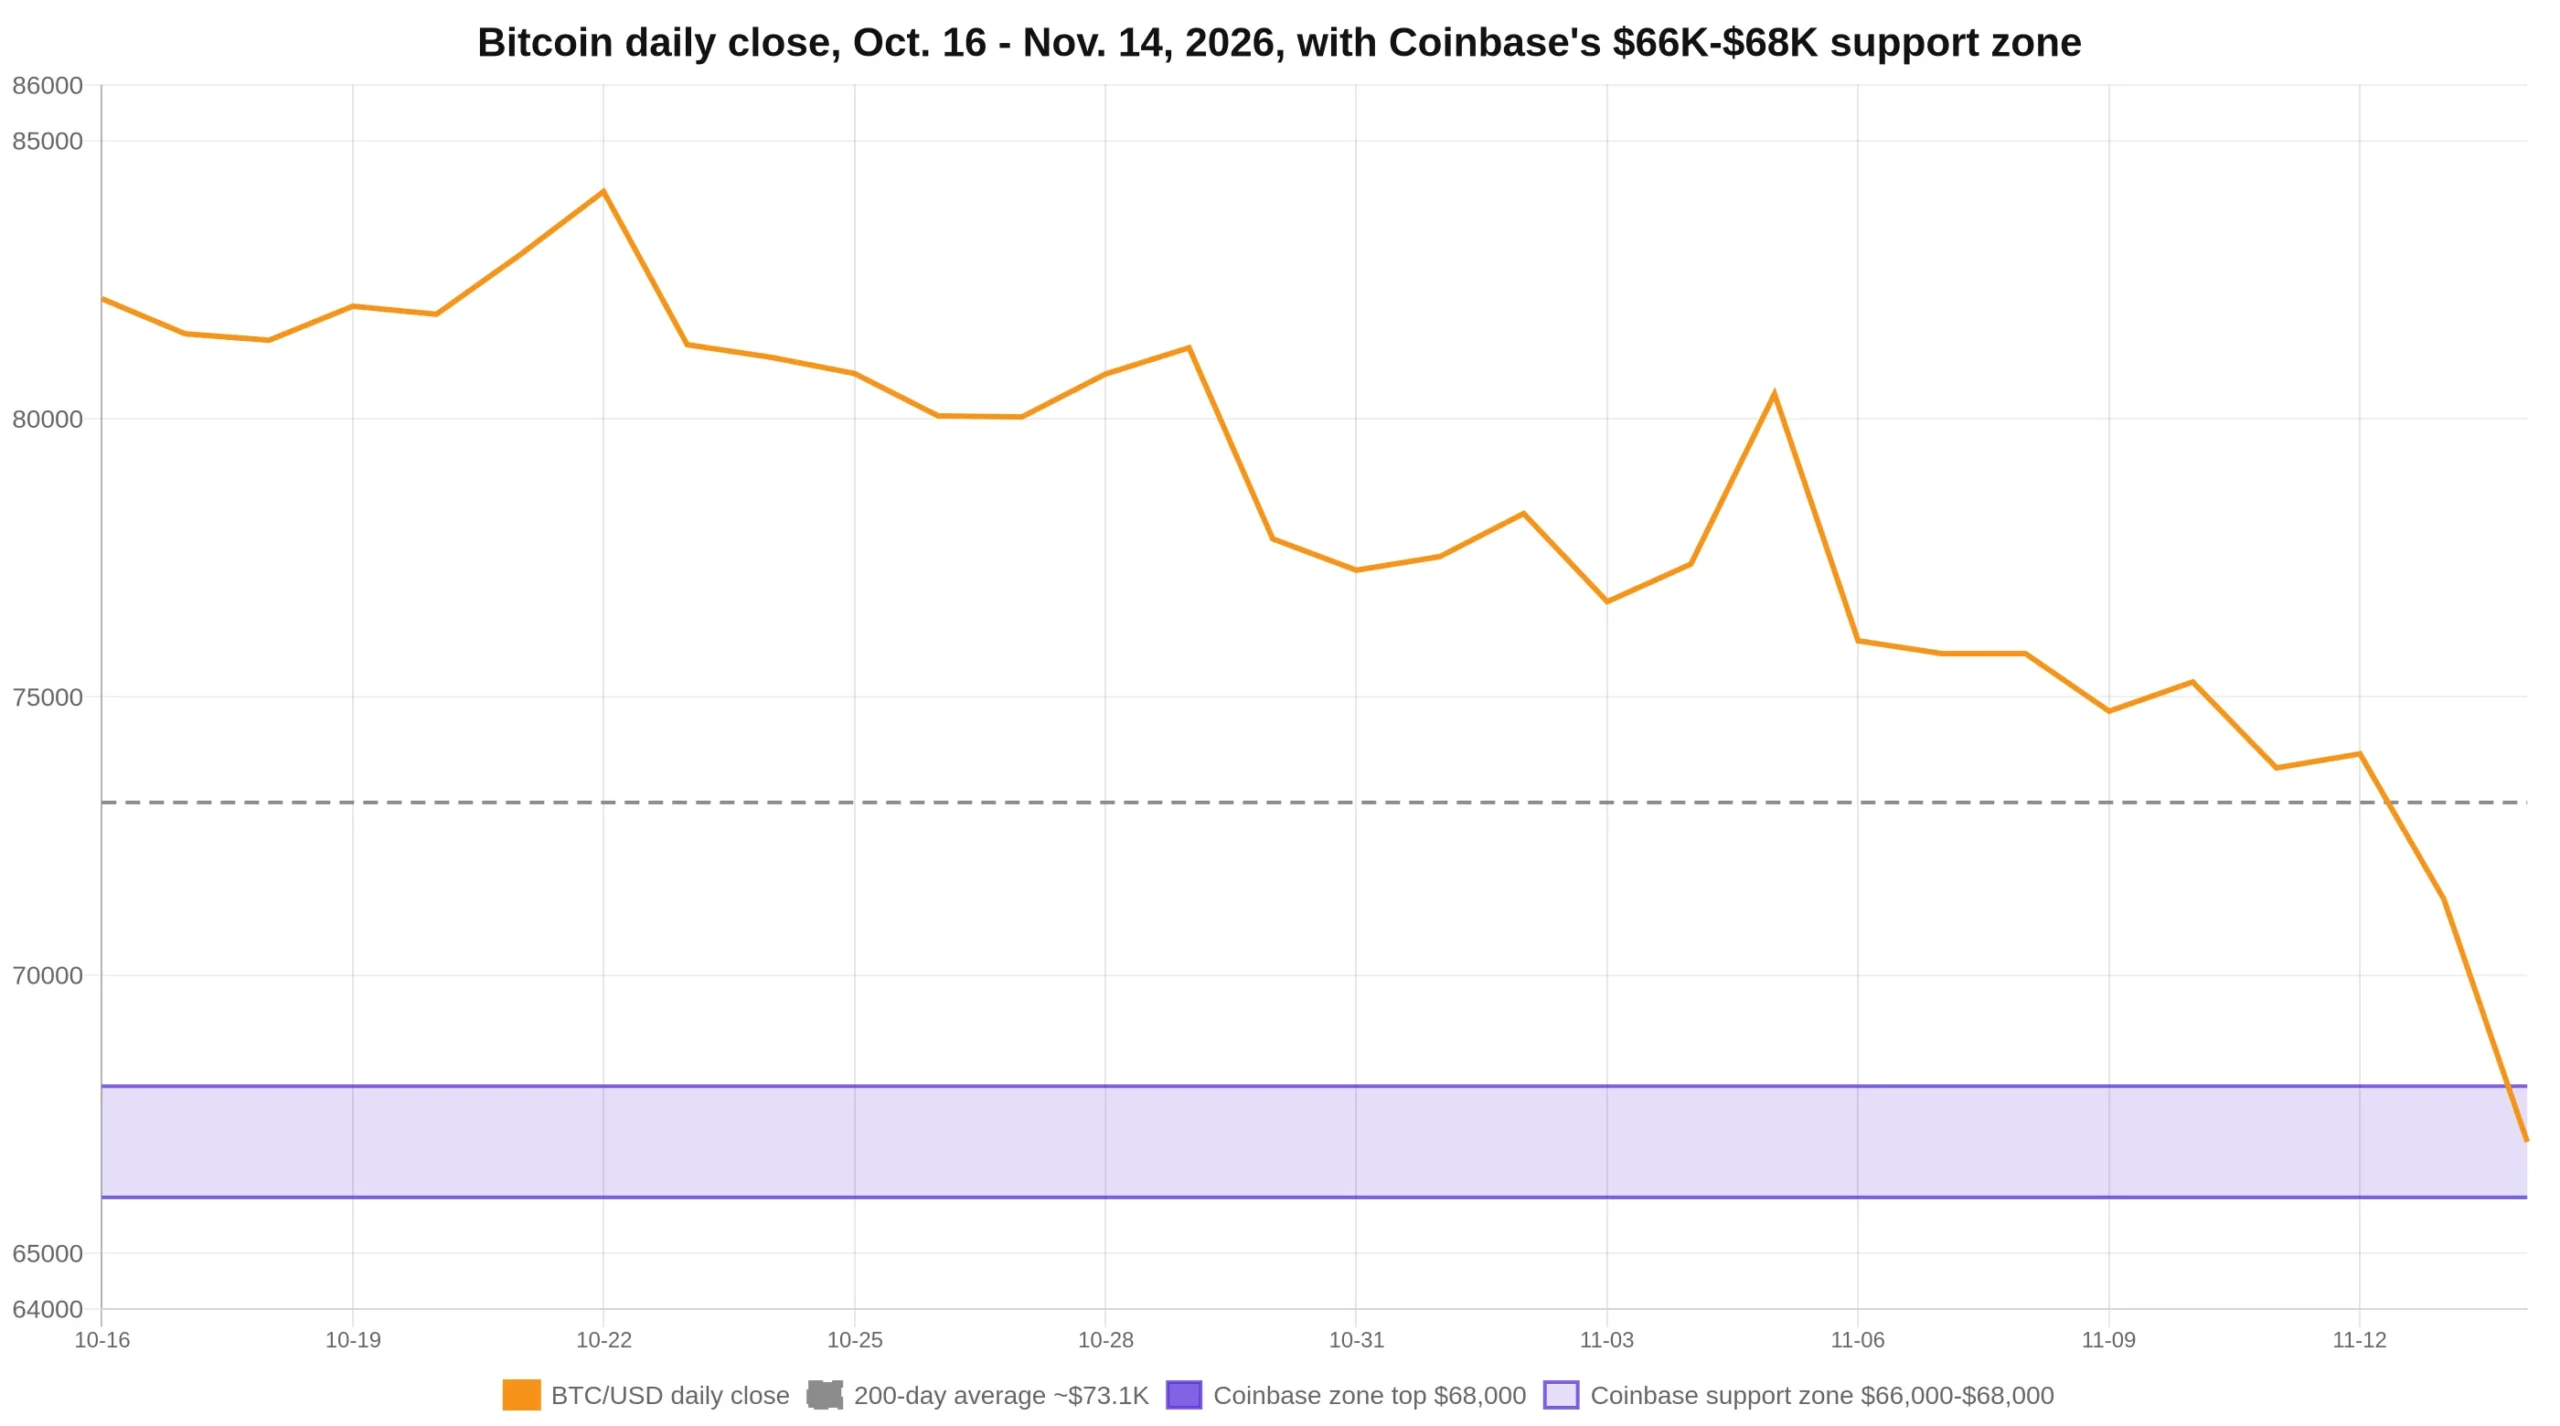
Bitcoin printed $66,999 on CoinGecko at 07:55 UTC on Nov. 14, down 2.44% in 24 hours and 20.32% below the $84,082.27 close of Oct. 22. That price is not a round number someone picked on a chart. It is inside the $66,000 to $68,000 band that Coinbase Institutional named on Nov. 13 as the next support area in its weekly market commentary, a band the desk said would become “notably more likely” once bitcoin held below $73,000.
So the answer to “best crypto to buy now” this morning is a level rather than a ticker: the supply cluster that last changed hands between $65,000 and $68,000, roughly 855,000 BTC, is now trading at a loss and deciding whether it becomes support or supply. Everything below is the ledger behind that sentence, the arithmetic on what a 2x would cost from here, and the three conditions that would prove the read wrong. Prices are CoinGecko quotes at 07:55 UTC on Nov. 14, 2026 and will move.
The floor Coinbase drew on Nov. 13 is now the price
The weekly, written by senior quantitative strategist Colin Basco, put the argument in one bolded sentence: “We think holding under the $73-75K zone would notably raise the probability of a move toward the $66-68K support zone.” It repeated the point in the technical section: “In our view, staying below $73K would make a move toward the next support area at $66-68K notably more likely.”
What makes the band more than a line on a chart is the overlap the report itself identifies. Bitcoin’s 200-day moving average sits near $73,100, which the price has already lost after the $1.62 billion long flush. The $66,000 to $68,000 area is where three separate measures converge: the cost-basis cluster from on-chain age bands, dense pivot support from earlier ranges, and the 200-week moving average. Coinbase’s own supply-by-cost-basis chart puts 1.32 million BTC in the $80,700 to $84,800 bucket, 302,000 more than a month earlier, and another 994,000 BTC near $91,000. The $65,000 to $68,000 bucket holds about 855,000 BTC.
Two numbers follow from that. At $66,999 the 855,000 coins in the current band are under water, which is why the next few sessions are a test of holders rather than of analysts. And the same coins represent about $57.3 billion of supply at today’s price, 4.3% of the roughly 20.11 million BTC in circulation, which is enough to matter if a fraction of it decides to sell into any bounce.
The upside case in the same document is specific and short-dated. “If bitcoin can reclaim and hold the $73-75K zone over the next few days, then we think a move back toward $80K becomes more plausible,” the report says, and elsewhere calls $80,000 to $82,000 “a critical resistance zone.” Reaching $73,100 from here is a 9.11% advance. Reaching $80,000 is 19.40%, which would put Bitcoin’s market value at $1.609 trillion against $1.347 trillion today. For context on how far the tape has travelled, the Oct. 22 close of $84,082.27 is 25.5% above the current print.
Seven sessions, $1.91 billion, and eleven straight IBIT redemptions
The mechanical seller has a public ledger. Farside Investors’ daily column for the US spot Bitcoin funds shows net redemptions in seven consecutive sessions, from Nov. 5 through Nov. 13: negative $430.2 million, negative $411.9 million, negative $201.0 million, negative $95.0 million, negative $299.8 million, negative $284.1 million and negative $185.4 million. Summed, that is negative $1,907.4 million, or roughly $1.91 billion out of the category in seven trading days. The total is not printed on the tracker; it is the arithmetic of its own column.
The Nov. 13 row, the first one published after the Coinbase note, is thin by the standards of the week but not small: IBIT redeemed $143.5 million, FBTC $41.9 million, and every other fund in the table recorded zero. Those two issuers accounted for the entire $185.4 million. Across the seven sessions IBIT alone accounts for negative $1,416.4 million, or 74.3% of every dollar that left the group, and the fund has now printed redemptions in eleven consecutive sessions when the streak reported through Nov. 11 is extended by the last two rows.
The Ethereum funds broke the pattern on the same day, and the detail matters for anyone reading this as a Bitcoin-only event. Farside’s ether column shows an inflow of $2.3 million on Nov. 13, with Fidelity’s FETH taking in $11.6 million and Grayscale’s mini trust losing $9.3 million. That is the first positive session after six consecutive redemptions from Nov. 5 to Nov. 12 that removed $594.4 million. One day of $2.3 million does not reverse a $594 million run, and it is not evidence of demand returning. It does mean the two largest ETF complexes stopped moving in the same direction for the first time in two weeks, which is worth noting before treating the whole market as a single trade.
What $1,000 buys at 07:55 UTC
Market-cap arithmetic is the only honest way to compare assets at different prices, because a $0.98 token and a $66,999 token are the same thing once you own the same dollar of market value. The table uses CoinGecko’s circulating supply, so the market-cap figures are the tracker’s, not a projection.
| Asset | Price at 07:55 UTC | 24h change | $1,000 buys | Market cap at 2x |
|---|---|---|---|---|
| Bitcoin | $66,999 | -2.44% | 0.01493 BTC | $2.695 trillion |
| Ethereum | $1,892.94 | -2.36% | 0.5283 ETH | $462.68 billion |
| Solana | $75.11 | -6.04% | 13.31 SOL | $88.84 billion |
| XRP | $0.9818 | -4.40% | 1,018.5 XRP | $124.69 billion |
| Zcash | $906.98 | -3.91% | 1.1026 ZEC | $30.89 billion |
| Monero | $528.01 | -0.12% | 1.8939 XMR | $19.89 billion |
The last column is where retail arithmetic usually goes wrong. A 2x on Monero asks for $9.94 billion of net new money to buy a $9.94 billion asset. A 2x on Bitcoin asks for $1.347 trillion. The percentage gain is identical; the capital that has to show up is 135 times larger. That is not an argument against Bitcoin. It is an argument against reading the same percentage move on two assets as the same event.
The defensive comparison this morning is Monero, down 0.12% against Solana’s 6.04%, a 5.92-point gap. Treat it as a description of the tape, not as a recommendation or a rotation. Privacy assets trade on their own flow, and a market cap of $9.94 billion means a few hundred million dollars of buying or selling moves the price further than it would on a $1.35 trillion asset. Relative strength in a $10 billion token during a $1.35 trillion drawdown is a sign of thin liquidity as often as it is a sign of demand.
The funding that never reset
Coinbase’s most useful observation for anyone trying to time an entry is not about price at all. “Perpetual funding, the annualized rate leveraged longs pay to keep their positions open, remains elevated at levels we haven’t seen since August 2025,” the report says. It then addresses the obvious objection directly: “Nor has the fall in bitcoin prices pushed it down very far.” The 3-month futures basis has risen to its highest since October 2025. Futures open interest fell just 3.9% since Nov. 4, to $36.4 billion. In the spring selloff, by comparison, funding went negative and reached about negative 7.5% on April 20.
Read plainly: leverage has not been washed out. Positions were marked down but not closed, which is why the cost of holding a long is still near a 15-month high while the asset is 20% off its October high. A market where the funding rate stays elevated through a decline is one where the marginal long is still paying to stay in, and that is the setup that produces a second leg rather than a bottom.
The same logic runs through the holder data. Coinbase counts 8.44 million BTC now held at a loss, up 2.61 million in 30 days and the most since Aug. 17. That is 42.0% of circulating supply. Another way to see it: prices are now below Strategy’s average purchase cost of roughly $75,500, which the report flags as the reason “it is harder for the treasury to continue buying” after MSCI confirmed on Nov. 11 that the company leaves its global indexes after the Nov. 30 close, an event J.P. Morgan estimates could trigger $8.8 billion of passive outflows if other index providers follow.
The miner data points the same way and gives a date. Hashprice, what a miner earns per unit of computing power per day, stood at $32.5 per PH/s on Nov. 10, about 15% above its June record low. If the hash rate holds near 951 EH/s, Coinbase estimates the hash ribbon will flag a new miner capitulation in roughly 10 days, which puts the signal in the last week of November. The report is careful about what that would mean: “Unfortunately, we wouldn’t treat a late-November capitulation as a bottoming signal on its own because since the 2024 halving, continued losses followed six of the seven capitulations.”
Stablecoins shrank faster than they did after TerraUSD
The funding pool that buys crypto on-chain has contracted at a record pace. “Over the past 30 days, stablecoin supply fell $11.5B making it the largest drop observed to-date,” the report says, before offering the comparison that gives the number scale: roughly $9.2 billion left the stablecoin supply after TerraUSD collapsed in May 2022. This drawdown has removed 25% more than that event did.
Put the $11.5 billion against today’s float and the mechanism is easier to see. CoinGecko prices USDT at a $175.26 billion market cap, USDC at $68.98 billion, USDe at $4.93 billion and DAI at $4.45 billion, a combined $253.62 billion. The 30-day contraction is 4.53% of that pool. Stablecoins are the dollars that sit on exchanges waiting to be deployed, so a 4.5% shrink is the on-chain equivalent of a bid stepping away: it does not force prices down by itself, but it removes the marginal buyer that turns a dip into a bounce. As the report puts it, “Stablecoins typically provide the onchain dollars used to buy crypto, but that pool of funding has been shrinking.”
The US-specific measure agrees. Coinbase’s own premium over offshore venues averaged negative 0.13% over the past week, meaning American buyers were paying slightly less than the rest of the world for the same coin, the opposite of the pattern that shows up when US institutions are accumulating. That gap has been negative every session since 4 September, and most of it tracks the USDT basis rather than US selling.
The dates that decide the next $1,000
Three scheduled items sit between this price and a cleaner entry, and each has a source rather than a hunch.
The December FOMC meeting is the largest. Futures fully price a 25 basis point hike at that meeting with a 12.5% chance of 50 basis points, and roughly 64 basis points of hikes over the next 12 months, up from 37 basis points earlier in November, after October payrolls printed 165,000 against a 65,000 consensus with an 84,000 upward revision to the prior two months and both inflation measures came in a tenth above consensus. Governor Christopher Waller said on the CPI release day that a 50 basis point move is possible. The report’s conclusion is uncomfortable for anyone buying the dip on macro hope: “Any recovery before the meeting will likely have to rely on crypto-native buying.”
The second is the hash ribbon window in the last week of November, which the report explicitly declines to treat as a buy signal on its own. The third is Nov. 30, when Strategy leaves MSCI’s global indexes at the close.
The dollar adds a fourth pressure that is not on a calendar. The dollar index has climbed to 102.9, the highest since April 2025. Bitcoin pays no yield, so a rising dollar and rising rate expectations both work against it in the same direction, which is why the report attributes the week’s selling to the Fed rather than to last month’s Binance hack even though the hack is the easier story.
Where this read breaks
A bearish level map is only useful if it comes with an invalidation, so here is the one the data supports. The read fails if Bitcoin reclaims and holds $73,000 to $75,000 for several sessions, which would restore the 200-day average and put $80,000 back in play. It also fails if Farside prints two consecutive inflow sessions while the stablecoin float stops shrinking, because that combination would mean the two mechanical sellers, ETF redemptions and the stablecoin drain, have both stopped at once. The third marker is funding: if perpetual funding resets toward zero without a liquidation cascade, the leverage overhang that makes a second leg likely has been removed.
Until one of those three happens, the honest description of this tape is a market testing a level that a large institutional desk drew in public a day earlier, with the largest single cohort of holders sitting exactly there. That is a reason to size positions carefully and to watch the $65,000 to $68,000 band, not a reason to call a bottom.
Frequently Asked Questions
What is the best crypto to buy right now?
There is no single answer, and this article is not investment advice. At 07:55 UTC on Nov. 14, Bitcoin traded at $66,999, inside the $66,000 to $68,000 support zone Coinbase Institutional published on Nov. 13, while the total crypto market cap stood at $2.284 trillion, down 5.07% in 24 hours. The assets that held up best were Monero at $528.01, down 0.12%, and Zcash at $906.98, down 3.91%, both far smaller and far thinner than Bitcoin.
Why is Bitcoin falling today?
Two measurable sellers are visible. US spot Bitcoin ETFs recorded net redemptions in seven consecutive sessions through Nov. 13 totalling $1,907.4 million per Farside Investors, with IBIT responsible for $1,416.4 million of it, and stablecoin supply contracted by a record $11.5 billion over 30 days per Coinbase Institutional. Coinbase attributes the move primarily to Fed pricing, with futures now implying about 64 basis points of hikes over 12 months, rather than to October’s Binance hack.
What are the key Bitcoin support and resistance levels?
Coinbase Institutional’s levels are $66,000 to $68,000 as support, where a supply cluster of about 855,000 BTC and the 200-week moving average overlap, and $62,000 below that. Resistance sits at $73,000 to $75,000, the zone that contains the 200-day average near $73,100, and then $80,000 to $82,000, where 1.32 million BTC last changed hands.
How much would Bitcoin need to gain to reach $80,000?
From $66,999, Bitcoin needs a 19.40% advance to reach $80,000. Because supply is fixed near 20.11 million coins, the market cap would rise from $1.347 trillion to $1.609 trillion, which is the amount of net new money that has to enter the asset for that price to hold.
Has the ETF selling stopped?
Not as of the last published session. Farside’s Nov. 13 row shows $185.4 million of net redemptions from the US spot Bitcoin funds, the seventh consecutive negative session. The ether funds did flip positive on the same day with a $2.3 million inflow, their first after six straight outflow sessions that removed $594.4 million.
Data: Farside Investors, Farside Ethereum flows, CoinGecko. Research: Coinbase Institutional Weekly Market Commentary, Nov. 13, 2026. All prices are CoinGecko quotes at 07:55 UTC on Nov. 14, 2026 and will change.
This article is not intended as financial advice. Educational purposes only. Prices cited are CoinGecko quotes taken at 07:55 UTC on November 14, 2026 and will change.
About the author
A freelance writer with a passion for crypto, delivering insightful and accurate content on blockchain and fintech. With a knack for translating complex concepts into accessible content, Eric produces well-researched articles, blog posts, and thought leadership pieces that cover the latest trends and developments in the digital finance space. His writing is aimed at educating and engaging both newcomers and industry experts, offering fresh insights into the world of cryptocurrencies, decentralized finance (DeFi), and blockchain innovations. Eric’s dedication to quality and accuracy makes him a trusted voice in the fintech and crypto communities