


- 1. What the Two-Day Print Actually Says
- 2. The Leverage That Broke on Thursday Has Not Rebuilt
- 3. The Level That Matters Is $75,775
- 4. The Relative Trade Is Ethereum at 2.96% of Bitcoin
- 5. Zcash Is Up 3.5% and That Is the Expensive Part
- 6. What $75,969 Buys in Market-Cap Terms
- 7. The Macro Variable That Sits Behind the Tape
- 8. What Would Change the Read
- 9. Frequently Asked Questions
Bitcoin is still the default buy at $75,969, but the cleaner trade on 7 November is relative rather than absolute. BTC has added 0.43% in 24 hours while US spot Bitcoin ETFs removed $842.1 million across the two sessions to 6 November, according to Farside Investors. The price held and the funds bled, and both numbers are small enough relative to the market that neither one settles the argument.
The arithmetic is worth doing before the narrative. The $842.1 million that left on 5 and 6 November equals 11,085 BTC at the current price, or 0.055% of Bitcoin’s $1.5276 trillion market value, per CoinGecko data timestamped 05:57 UTC. CoinGecko also puts 24-hour spot volume at $26.04 billion, which makes the two-day outflow 3.2% of one day’s trading. That is a real number and a modest one, and the distinction matters for anyone deciding what to buy now.
What the Two-Day Print Actually Says
The 6 November column is almost a single-fund story. IBIT redeemed $403.0 million, ARKB $20.5 million, BITB $20.1 million and GBTC $11.1 million, while FBTC took in $42.8 million. Net was minus $411.9 million. Strip out IBIT and the day would have printed minus $8.9 million, which is noise for a market this size.
The previous session was broader. On 5 November, FBTC led the redemptions at $199.9 million, IBIT redeemed $105.0 million, GBTC $49.9 million, EZBC $32.9 million and HODL $23.6 million, for a net minus $430.2 million. Two consecutive negative days of that size, back to back after a positive $74.6 million on 4 November, is the pattern to watch. It is a two-day run, not a trend: November’s five sessions net to minus $1,281.7 million, and the six sessions from 30 October net to minus $1,924.9 million, or 25,338 BTC at today’s price.
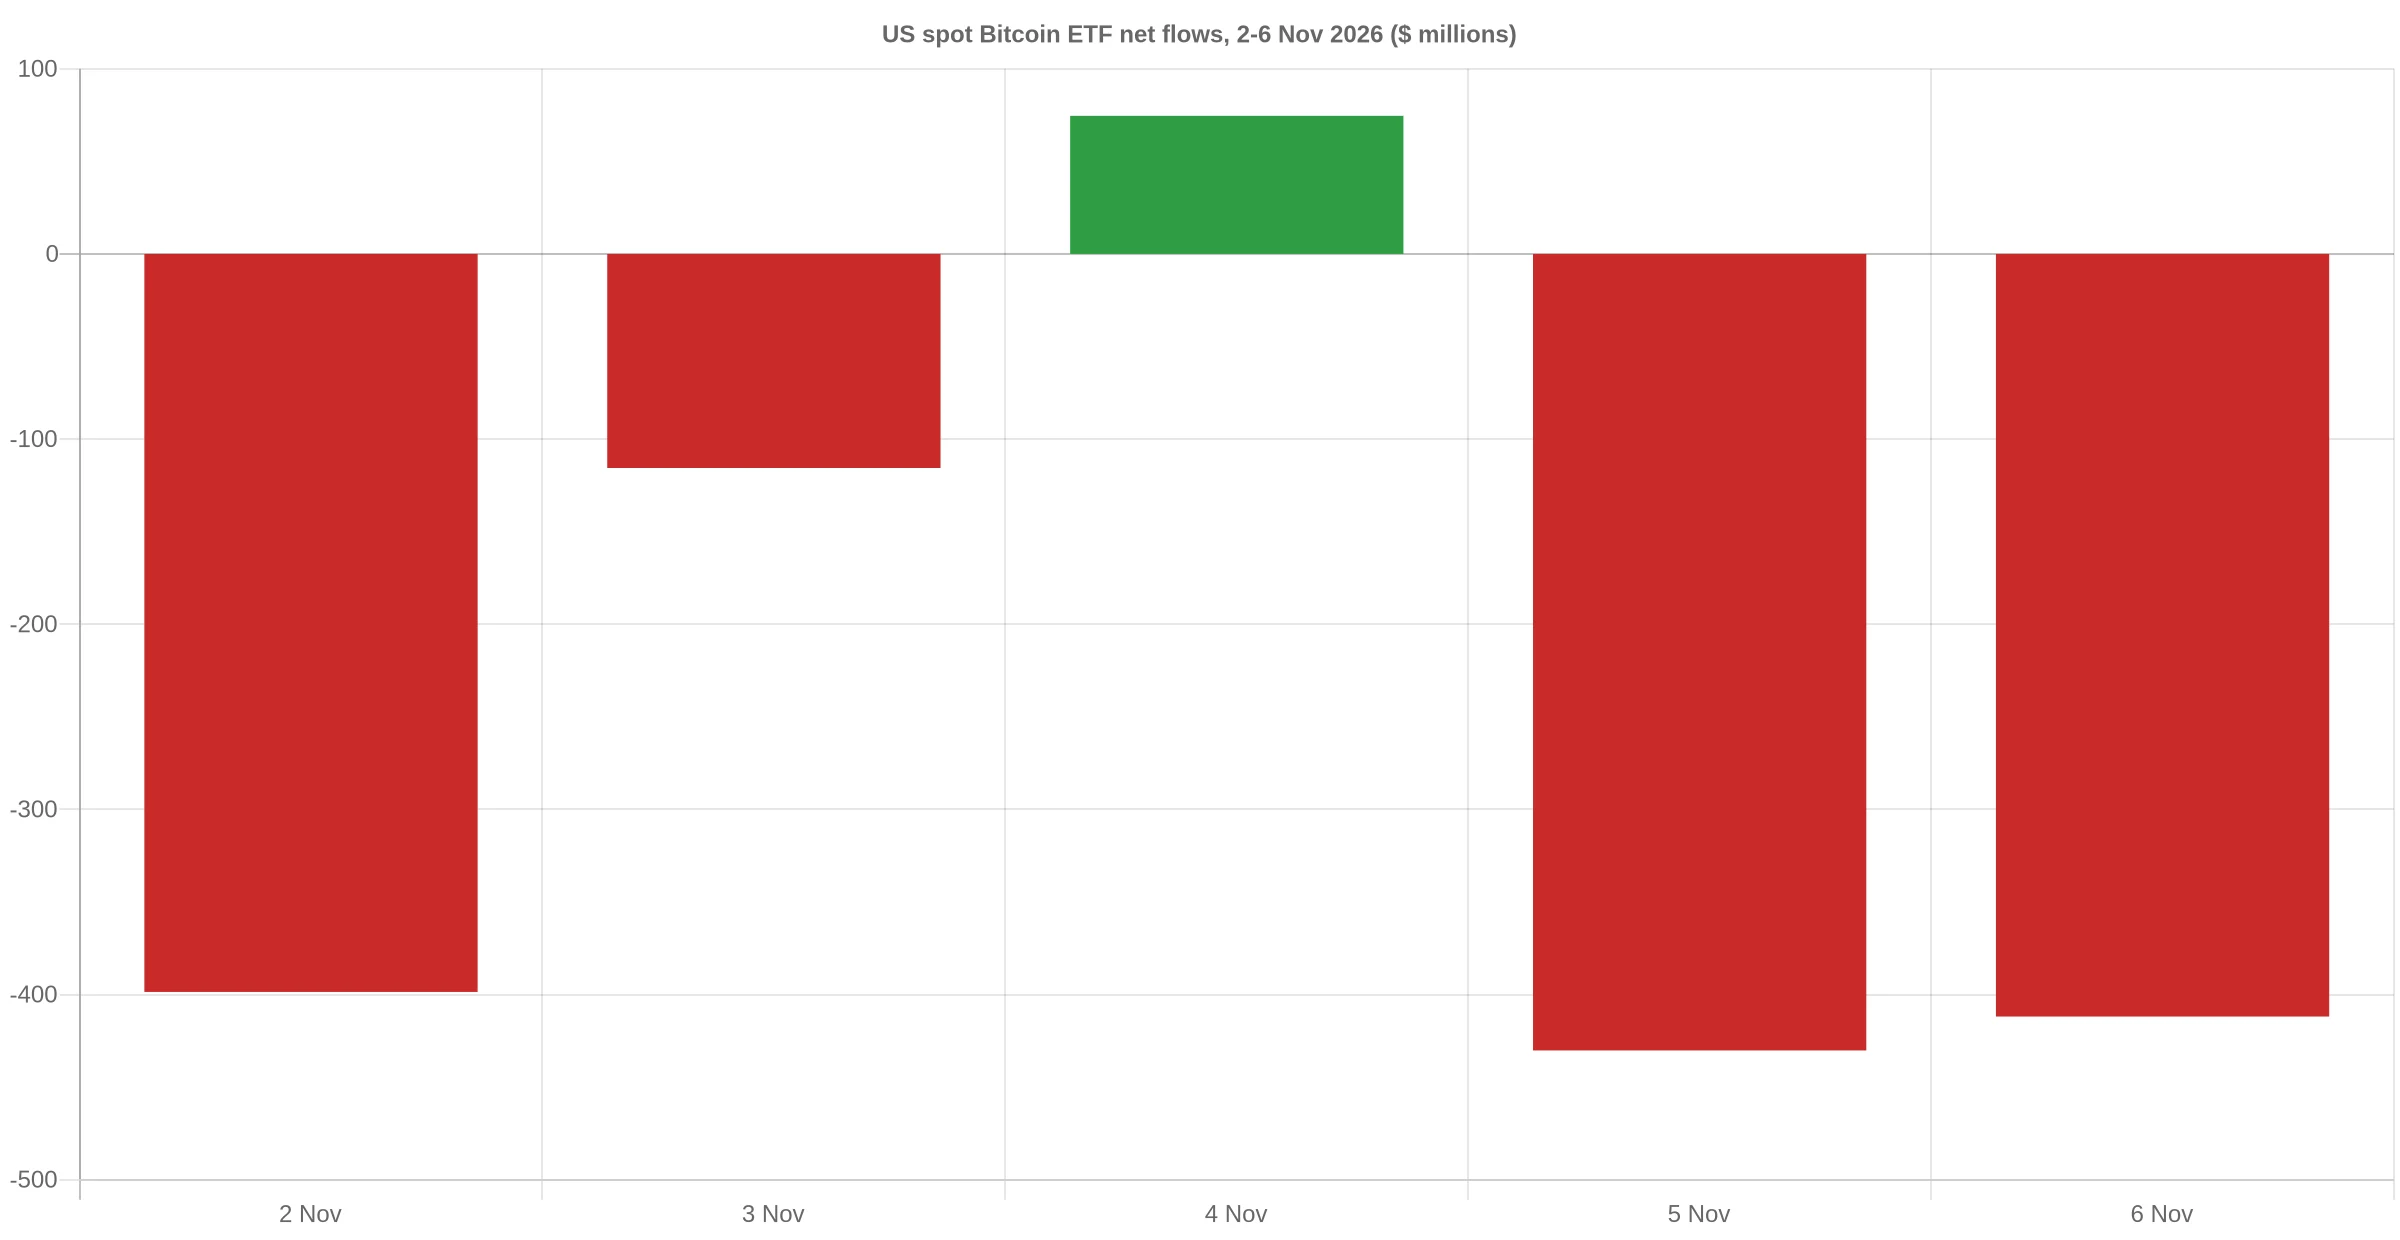
One caution on the framing that has circulated all week: ETF redemptions are not the same thing as spot selling, and the flow print is a settlement figure published after the fact. The two datasets coincided. The available evidence does not establish which moved first, or how much of the 30 October decline traced to the $643.2 million that left the funds that day.
The Leverage That Broke on Thursday Has Not Rebuilt
The derivatives book tells a cleaner story than the flow data. Perpetual funding on Binance, read at 06:00 UTC, shows Bitcoin longs paying 0.001891% per eight-hour interval, which annualises to 2.07% at three settlements a day. Ethereum sits at 0.006713%, or 7.35% annualised, Zcash at 0.0100% (10.95%), Solana at 0.009313% and XRP at 0.007817%, per the exchange’s real-time funding table.
A funding rate near 2% annualised is what a deleveraged book looks like. It says longs are not paying much to stay long, which is consistent with the forced selling that Thursday’s $1.26 billion liquidation print removed. It does not say the next move is up. Funding is a price of carry, not a forecast, and a market can sit at low carry for weeks.
Binance’s BTCUSDT open interest was 95,672 BTC at the same timestamp, about $7.27 billion at the $75,984 mark price. That is one venue’s slice of a global book; it is useful for direction of travel, not for sizing a position.
The Level That Matters Is $75,775
Bitcoin’s 30-day range, measured on daily closes from CoinGecko, runs from $84,082 on 9 October to $75,775 today. The 20-day average is $79,374. At $75,969, BTC sits 9.67% below the 30-day high, 4.32% below the 20-day average and 0.23% above the 30-day low.
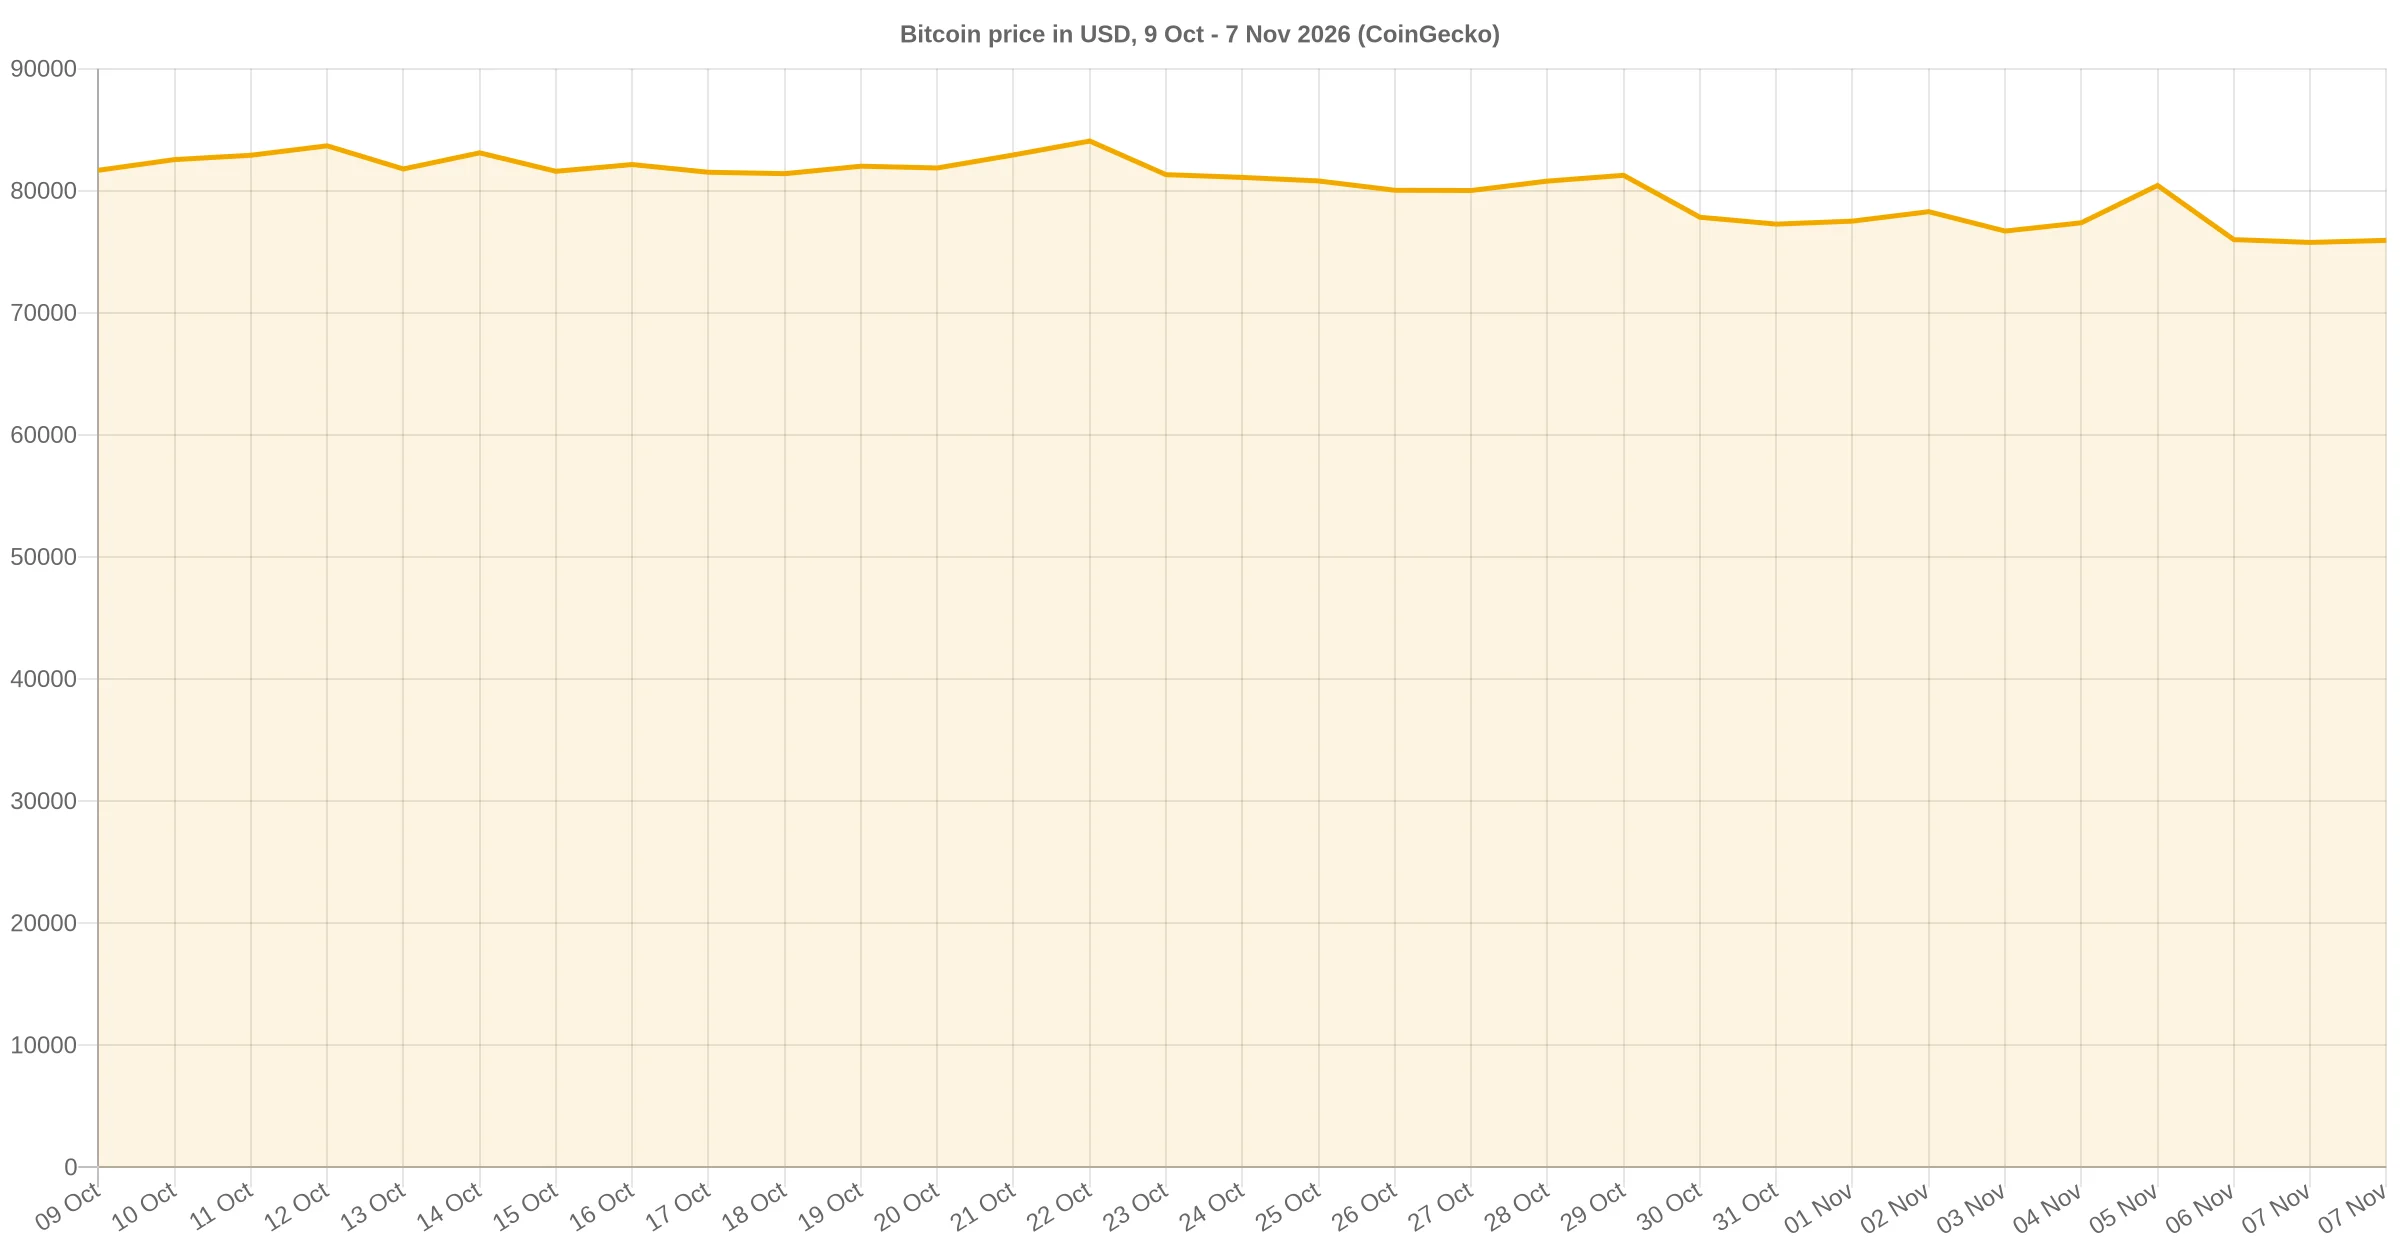
The methodology is deliberately simple because simple levels are the ones that hold: daily closes, no intraday wicks, a 30-day window. On that basis $75,775 is the line that defines the trade. A daily close below it leaves no closing support inside the measured window, so a stop placed there is the only defensible risk definition. A daily close back above $79,374, the 20-day average, would say the November drawdown has been absorbed rather than extended.
Neither level is a prediction. They are reference points that make the risk calculable, which is the difference between buying a discount and buying a falling price.
The Relative Trade Is Ethereum at 2.96% of Bitcoin
Ethereum trades at $2,247.24, up 1.02% in 24 hours against Bitcoin’s 0.43%. The ratio, 0.0296 ETH per BTC, means one Ether costs 2.96% of one Bitcoin, and the $274.6 billion Ethereum market value is 18.0% of Bitcoin’s. Ether’s funding, at 7.35% annualised, is 3.5 times Bitcoin’s, so the relative move is not being driven by a crowded long.
That combination, outperformance with cheaper carry than Zcash and XRP but more expensive than BTC, is the closest thing in today’s data to a clean relative-value trade. It is also the least dramatic, which is usually a feature rather than a bug.
Zcash Is Up 3.5% and That Is the Expensive Part
Zcash at $1,312.04 is the strongest large-cap in the sample, up 3.47% in 24 hours, with a $22.35 billion market value that is 1.94 times Monero’s $11.51 billion. Monero fell 1.12%. The privacy sector is not moving as a block; ZEC is moving on its own.
The cost of that momentum is visible in the funding table. ZEC longs pay 10.95% annualised, 5.3 times Bitcoin’s rate and the highest of the five assets checked here. A trader buying ZEC for a 24-hour gain is paying carry that only makes sense if the move continues. Solana, by comparison, is up 0.93% at $90.16 on 9.31% annualised funding, and XRP is down 3.09% at $1.16 on 7.82%.
None of that makes Zcash a bad asset. It makes it a different trade from Bitcoin, with a holding cost that has to be earned every day.
What $75,969 Buys in Market-Cap Terms
Market-cap arithmetic is the part retail investors skip, and it is the part that sets expectations. A 10% move in Bitcoin from here adds $152.8 billion of market value. Doubling it requires $1.528 trillion of net new money, roughly five and a half times Ethereum’s entire market value. Those are not forecasts; they are the size of the move being asked for.
Against that scale, a $842.1 million ETF outflow is 0.055% of Bitcoin’s market value, and reversing the two-day print would take $842.1 million of net inflows. The best single day in the visible window was 4 November’s $74.6 million, so undoing two days of redemptions at that pace would take eleven sessions. That is the mechanical version of the question, and it is why flow data is a slow variable rather than a trigger.
The Macro Variable That Sits Behind the Tape
The Bank of England raised Bank Rate to 4% on 5 November, and its own summary is blunt about why. “At its meeting ending on 4 November 2026, the Monetary Policy Committee (MPC) voted by a majority of 8-1 to increase Bank Rate by 0.25 percentage points, to 4%,” the November Monetary Policy Summary states. The same document records that “UK CPI inflation increased to 3.5% in September” and is “now expected to rise to around 5% by the middle of next year.”
That is an energy-shock tightening, not a crypto-specific event, and the rate decision’s read-across to Bitcoin is indirect: higher policy rates raise the cost of holding a non-yielding asset. It is a backdrop. It is not the reason BTC printed $75,775 today, and treating it as the cause would be a causal claim the data does not support.
What Would Change the Read
Four observations would move this from a range trade to something else. First, two consecutive positive ETF sessions would break the current pattern and give the flow variable a direction. Second, a daily close above $79,374 would put Bitcoin back above its 20-day average. Third, Bitcoin funding above 0.01% per eight hours would signal that leverage is rebuilding, which historically precedes sharper moves in both directions. Fourth, a daily close below $75,775 would invalidate the level that makes the current setup measurable.
Until one of those prints, the honest description is a market holding a line while its largest passive wrapper shrinks. That is a setup to trade with a stop, not a thesis to buy on conviction.
Frequently Asked Questions
Is Bitcoin a buy at $75,969?
It is a defined-risk buy, not a conviction buy. BTC sits 0.23% above its 30-day low of $75,775 and 4.32% below its 20-day average of $79,374, so the entry only works with a stop at that low. Without the stop, the same $842.1 million of ETF redemptions that created the discount can extend it.
Why are Bitcoin ETFs losing money?
The funds are not losing money in the trading sense; they are being redeemed. On 6 November, IBIT alone accounted for $403.0 million of the $411.9 million net outflow, while FBTC took in $42.8 million, per Farside Investors. A redemption means an authorised participant handed back shares for the underlying asset, which is a flow event, not a performance figure.
Which crypto has the best relative strength today?
Zcash, up 3.47% in 24 hours at $1,312.04, against Bitcoin’s 0.43% and Ethereum’s 1.02%. The catch is carry: ZEC perpetual funding annualises to 10.95%, the highest of the five assets checked, so the position costs 5.3 times more to hold than a Bitcoin long.
What price invalidates the Bitcoin setup?
A daily close below $75,775, the bottom of the 30-day closing range. Below that level there is no closing support inside the measured window, so the stop that defines the trade no longer exists. A daily close back above $79,374, the 20-day average, would confirm the drawdown was absorbed.
How much have spot Bitcoin ETFs lost in November?
The five November sessions through 6 November net to minus $1,281.7 million, with $842.1 million of that leaving on 5 and 6 November. Over the six sessions from 30 October the total is minus $1,924.9 million, which equals 25,338 BTC at today’s price of $75,969.
Data: Farside Investors, CoinGecko, Binance, CoinGlass.