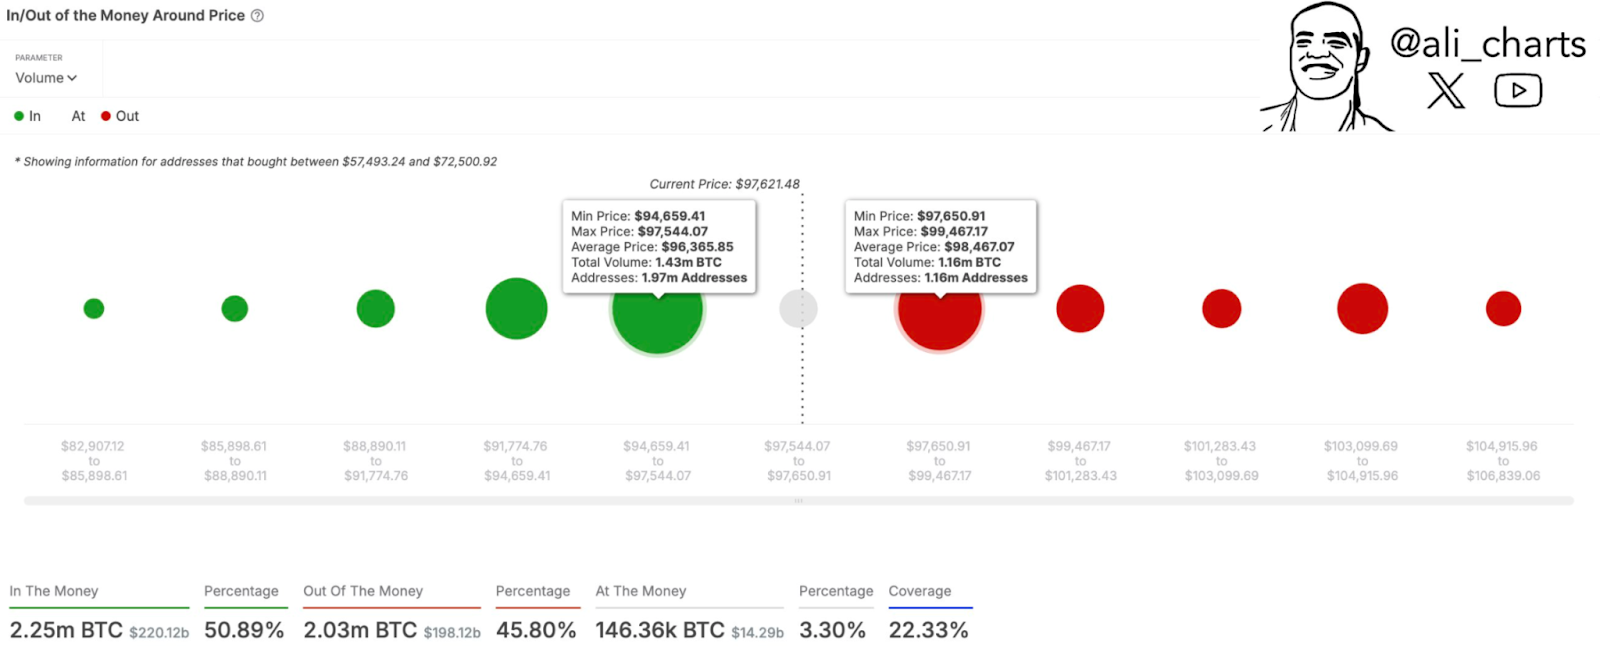
Bitcoin is currently at a critical juncture, with its price trapped between significant supply and demand walls. The latest data suggests that 1.43 million BTC has been accumulated between $94,660 and $97,540, forming a strong demand zone. Meanwhile, a substantial supply barrier of 1.16 million BTC exists between $97,650 and $99,470, making it a pivotal resistance level.
The Bitcoin price action is currently oscillating between these key levels, with market participants closely watching for a decisive breakout. If BTC manages to push above the $99,470 resistance, it could trigger a bullish rally. Conversely, a drop below the $94,660 demand zone might lead to further declines.
Technical Indicators Highlight Trend Potential
The chart visualization reflects the current distribution of BTC holdings, indicating that approximately 50.89% of BTC supply is “in the money” at the current price, while 45.80% remains “out of the money.” A minor 3.30% is classified as “at the money,” meaning these addresses acquired BTC near the current price of $97,621.48. The data suggests that Bitcoin’s next move could be heavily influenced by whether demand outweighs selling pressure.

BTC Data Chart | Source: Ali on X
With the cryptocurrency hovering near these supply and demand thresholds, a move in either direction could establish a new trend. If bulls manage to overcome the selling pressure above $97,650, Bitcoin may see a continued rally. On the other hand, failure to hold above $94,660 could invite further downside movement.


