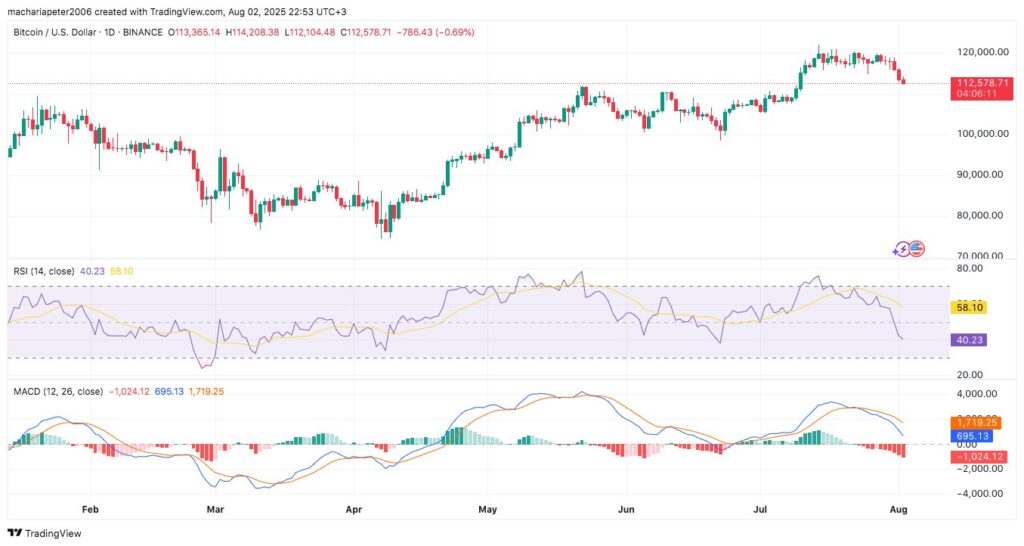
- Bitcoin falls to $112.6K, posting a sharp $800 drop in minutes amid liquidation concerns.
- Trading volume plunges 34% to $60.4B despite high volatility and market swings.
- RSI and MACD indicators show rising bearish momentum, signaling further downside risk.
Bitcoin experienced a sudden reversal with price action and technical indicators aligning to signal continued weakness in the market. After climbing above $113,800 during the early sessions, the asset declined steeply in the evening hours, eventually registering a 7-day low of $112,605.2. Data from Bybit’s 5-minute candlestick chart captured a sudden drop of over $800 in a single red candle, raising concerns of large sell-offs or forced liquidations.
The movement occurred before 8:00 PM, when Bitcoin fell from $113,437 to $112,605.2 within minutes. The breakdown followed three consecutive red candles, which had already weakened bullish momentum near the $113,400 resistance mark. Bitcoin was last recorded trading at $112,388.58, reflecting a 0.98% daily loss and a 1.59% decline from its intraday high. Market observers pointed to high-volume activity, with 24-hour turnover reaching $704.29 million, as a possible factor contributing to the price drop.
Trading Activity Declines Despite Market Moves
According to CoinMarketCap data, Bitcoin’s 24-hour trading volume fell 34.04% to $60.4 billion, even as the asset experienced large price swings. BTC’s total market capitalization remains at $2.23 trillion, while its fully diluted valuation is $2.36 trillion. The current volume-to-market cap ratio of 2.75% points to subdued activity in relation to Bitcoin’s overall market size. Circulating supply remains unchanged at 19.9 million BTC.

The drop in trading interest has coincided with declining momentum, as investors reassess positions near key psychological support levels. Analysts are paying close attention to the $112,000 zone as a possible shift, particularly as market depth typically thins heading into weekends.
RSI and MACD Confirm Weakening Momentum
Technical indicators show that Bitcoin may remain under pressure in the short term. The Relative Strength Index (RSI) has dropped to 40.23, down from a recent high of 58.10. Although it has not yet entered the oversold range, the indicator shows a loss of upward momentum.

The Moving Average Convergence Divergence (MACD) adds to the bearish picture. The MACD line is positioned at -1,024.12, while the signal line stands at 695.13, creating a wide divergence of over 1,700 points.


