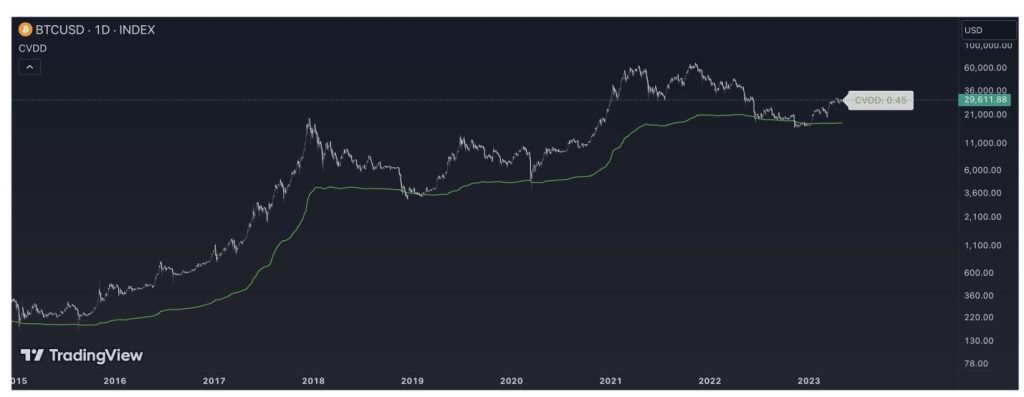
The chief crypto asset *BTC* has reportedly witnessed a slump. According to Lookonchain, a famous on-chain analytics provider, the whales on the popular crypto exchange Bitfinex have decreased long positions because of the respective dip. The platform provided the details of the present market status on its official account on X.
Bitcoin Faces Slump as Bitfinex Whales Reduce Long Positions, Reports Lookonchain
Lookonchain shared a series of posts on the social media platform in this respect. It pointed out 5 indicators signifying if it is the occasion to avoid the $BTC top. While discussing these indicators, the analytics forum noted about Rainbow Chart. As per Lookonchain, this indicator operates as a long-term valuation instrument. It utilizes a logarithmic development curve and forecasts the likely price direction of Bitcoin in the future.
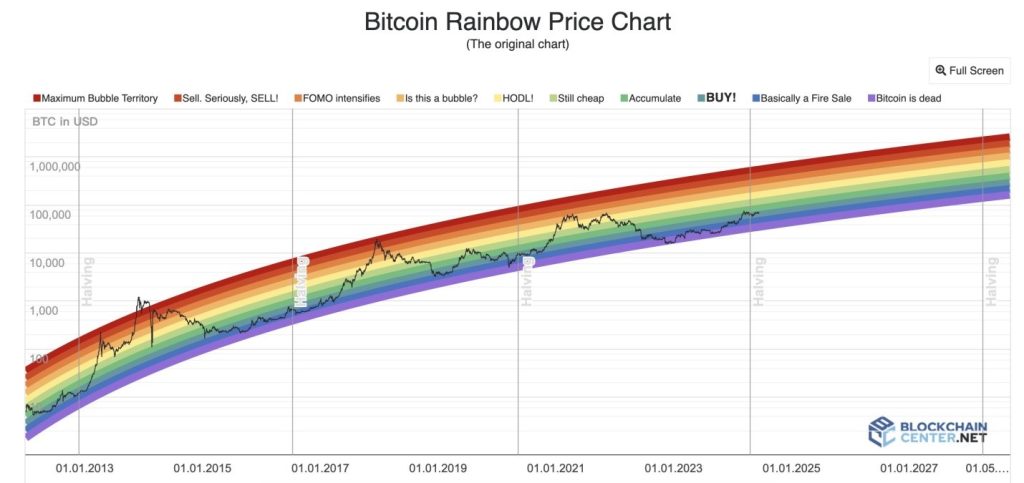
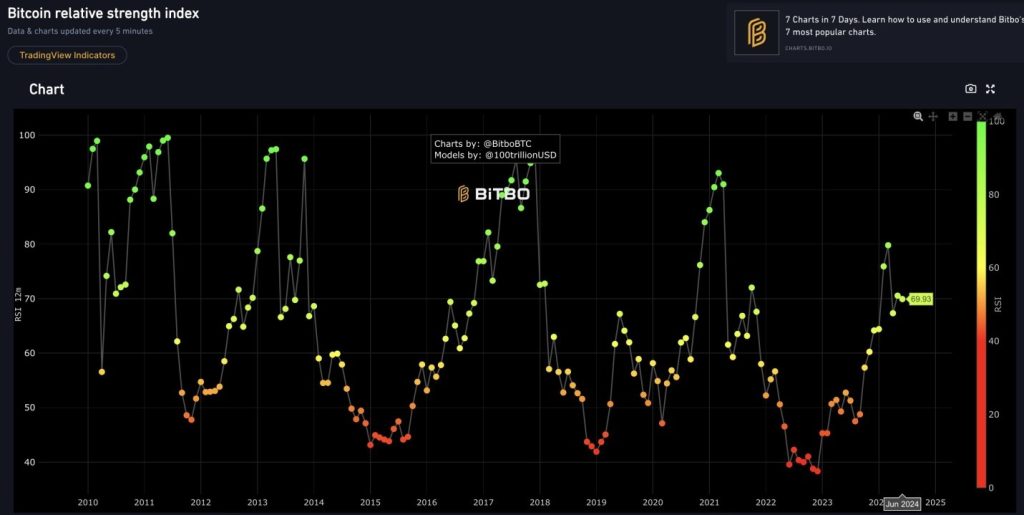
It added that the Rainbow Chart is even now displaying optimistic indications. The tool signifies that the current time is still good to purchase $BTC. Apart from that, the analytics firm also brought to the front the current status of the relative strength index chart. In line with the chart, there are two significant spots. At one spot, the indicator stands less than 70.
The respective position shows that Bitcoin is overbought. This situation can potentially pave the way for a fall soon. On the other end, the indicator stands above 30. This position implies that Bitcoin is oversold. This can likely lead to an elevation. The present point of the RSI indicator is nearly 69.93. The on-chain analytics platform also compared this spot to the former data.
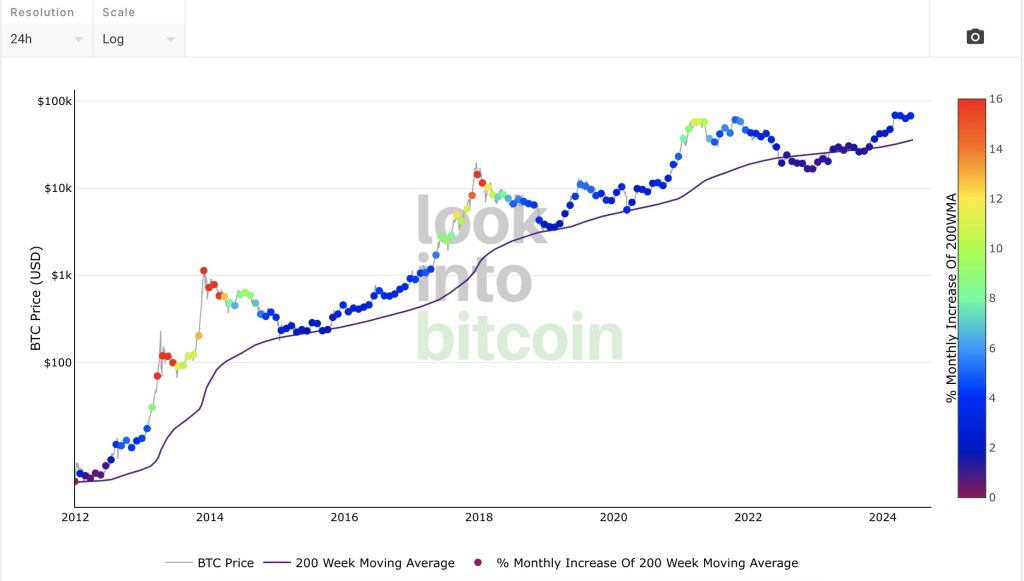
It asserted that the comparison with the former statistics shows that Bitcoin appears to have not yet touched its peak. In the case of the third indicator, Lookonchain revealed the chart presenting the 200 Week Moving Average Heatmap. The respective indicator says that the present price spot is blue. This means that the prominent crypto token has not yet seen its price top. This also suggests that there is still time for buying and holding BTC.
The 4th indicator is the Cumulative Value Coin Days Destroyed. As per this indicator, when the token reaches the green line, its price turns undervalued, denoting a fine buying opportunity. This indicator also says that Bitcoin has not touched its peak. Moreover, the 2-Year MA Multiplier is an indicator showing Bitcoin’s price between the green and red lines. The token has not yet touched the red line. It either has not touched the top.
