Bitcoin recently experienced a significant price drop, falling toward the $61K level and hitting a new monthly low. This sudden decline has raised concerns and questions among investors and traders. Understanding the reasons behind this plunge is crucial for anyone involved in the market. Several factors have contributed to this decline, including miner activities, Federal Reserve policies, lack of new inflows, and market indicators. Let’s delve into the key factors driving this downward trend.
These Key Factors Played Behind Bitcoin’s Decline
BTC Miners Sold in Large
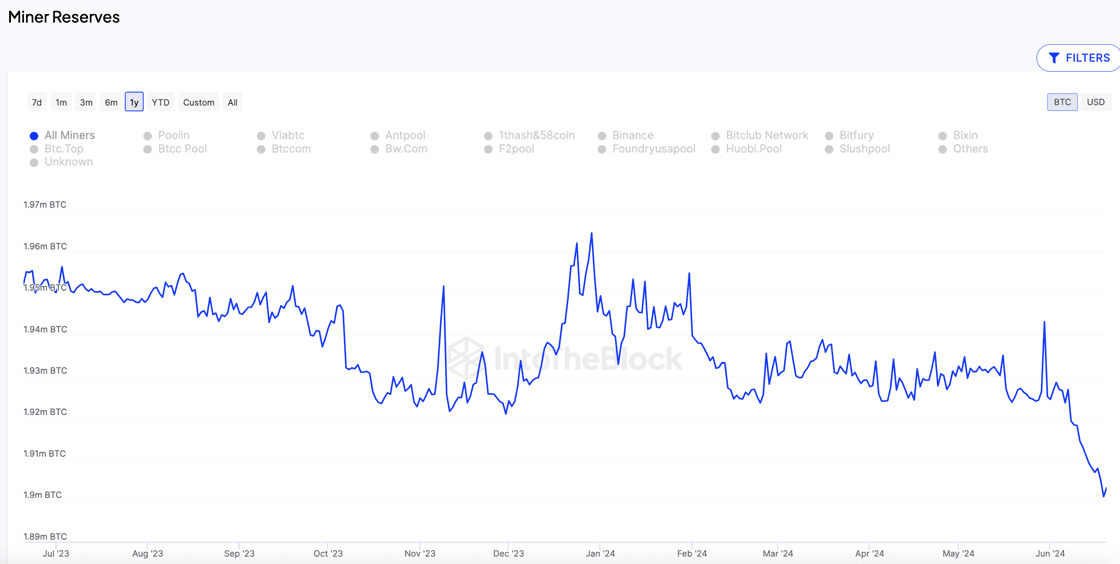
*BTC* miners play a crucial role in the recent decline. There has been a notable increase in selling from older wallets, predominantly held by miners. This trend follows the recent Bitcoin halving event, which cut daily production from 900 to 450 Bitcoins.

QCP Capital highlighted in a recent market analysis that Bitcoin miners are under significant selling pressure following increased break-even prices post-halving. Miner holdings of Bitcoin have dropped to their lowest in 14 years, with total reserves declining by 50,000 since the start of the year. Since the start of this month, miners have sold over 30,000 BTC, worth approximately $2 billion. This massive selling has primarily occurred on exchanges, directly contributing to the price dump.
Additionally, the German government moved $600 million worth of Bitcoin to exchanges, selling $200 million in a single day. With holdings of approximately $3 billion in Bitcoin, this sudden sell-off is uncommon and may be prompted by financial requirements amid economic pressures.
Federal Reserve Faces Liquidity Reversal
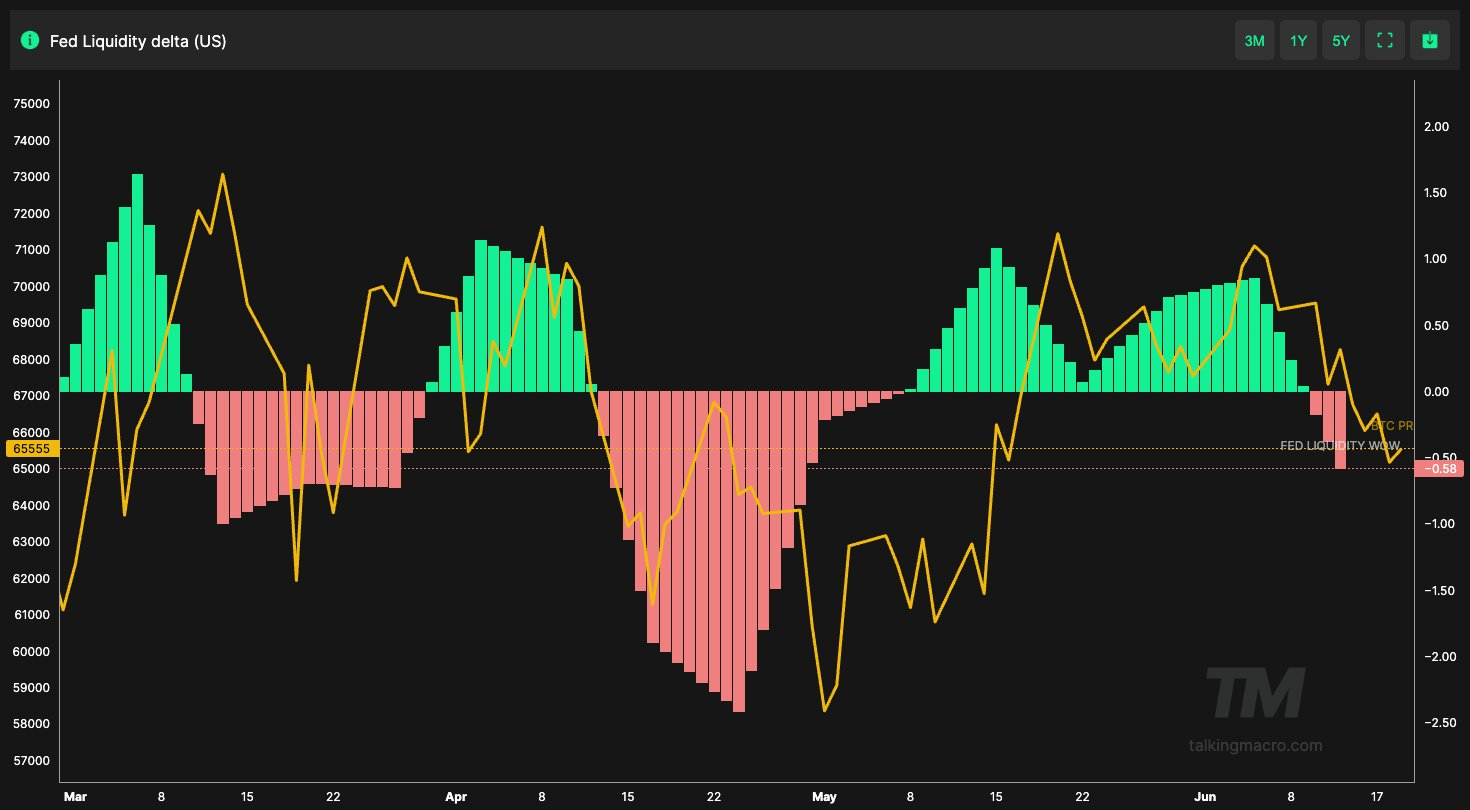
Another critical factor influencing Bitcoin’s price drop is the Federal Reserve’s recent liquidity reversal. Historically, Bitcoin’s price has shown a strong correlation with the Federal Reserve’s liquidity conditions. When the Federal Reserve pumps liquidity into the market, Bitcoin tends to benefit from the increased capital flow. Conversely, when liquidity is withdrawn, it often negatively impacts Bitcoin’s price.

In the past two weeks, the Federal Reserve’s liquidity has turned negative. This shift has created a direct impact on Bitcoin’s price, as less liquidity in the market means less capital available for investment in risk assets like cryptocurrencies.
BTC spot and derivatives traders are displaying strong bearish sentiment, driven by their focus on U.S. PCE inflation data and the monthly options expiry.
Bitcoin Experiences A Drop In ETF Inflow
U.S.-listed spot bitcoin (BTC) ETFs reported their fifth straight day of outflows on Thursday, totaling over $900 million for the week. Grayscale’s GBTC and Fidelity’s FBTC led with significant outflows of $53 million and $51 million, respectively. Only BlackRock’s IBIT saw modest inflows of $1 million, while other ETFs showed minimal net activity. Total trading volumes reached $1.1 billion, according to SoSoValue data.

A significant issue contributing to the recent Bitcoin price drop is the lack of new inflows into the market. Bitcoin ETFs (Exchange-Traded Funds), which are financial products that track the price of Bitcoin, have been experiencing consistent outflows over the past week. This trend indicates that investors are withdrawing their funds from these ETFs, adding more selling pressure on Bitcoin.

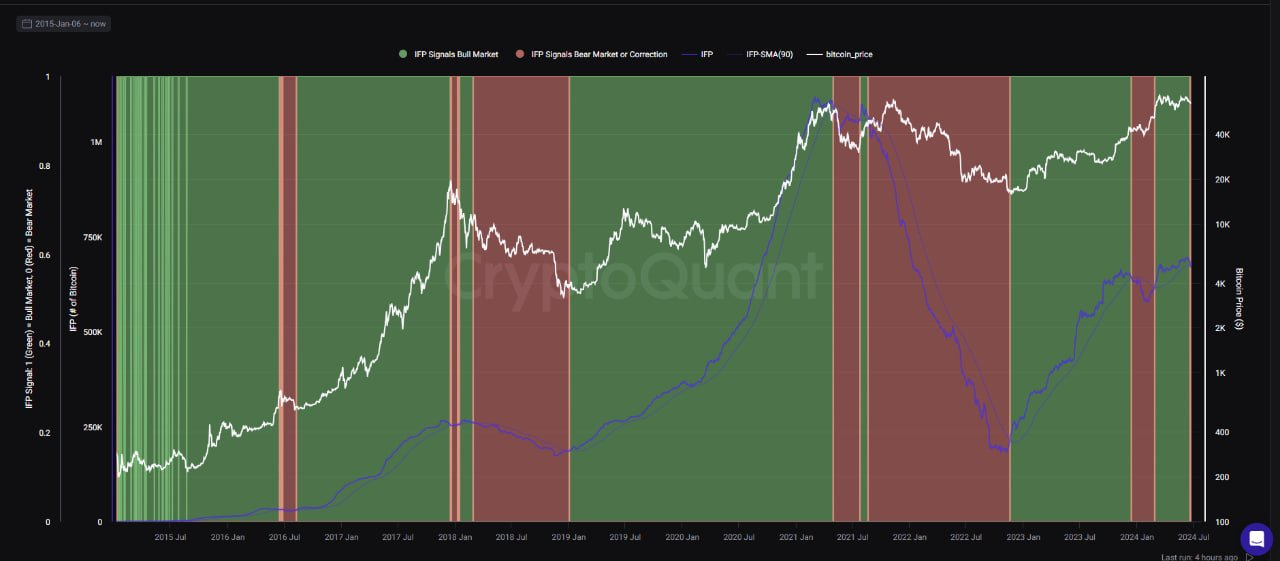
Additionally, the Inter-Exchange Flow Pulse (IFP) indicator, which measures the flow of Bitcoin from spot exchanges to derivative exchanges, has been falling. A declining IFP indicates that more Bitcoin is being sent to spot exchanges, which is typically a bearish signal.
Bitcoin Might Repeat Its History
Interestingly, Bitcoin has shown a tendency to make a bottom in June over the past few years. Since 2020, Bitcoin has found a bottom in June, and some analysts believe this pattern could repeat itself.
However, Bitcoin has always rebounded following the bottom. This time, we might see a similar trend.
What’s Next For BTC Price?
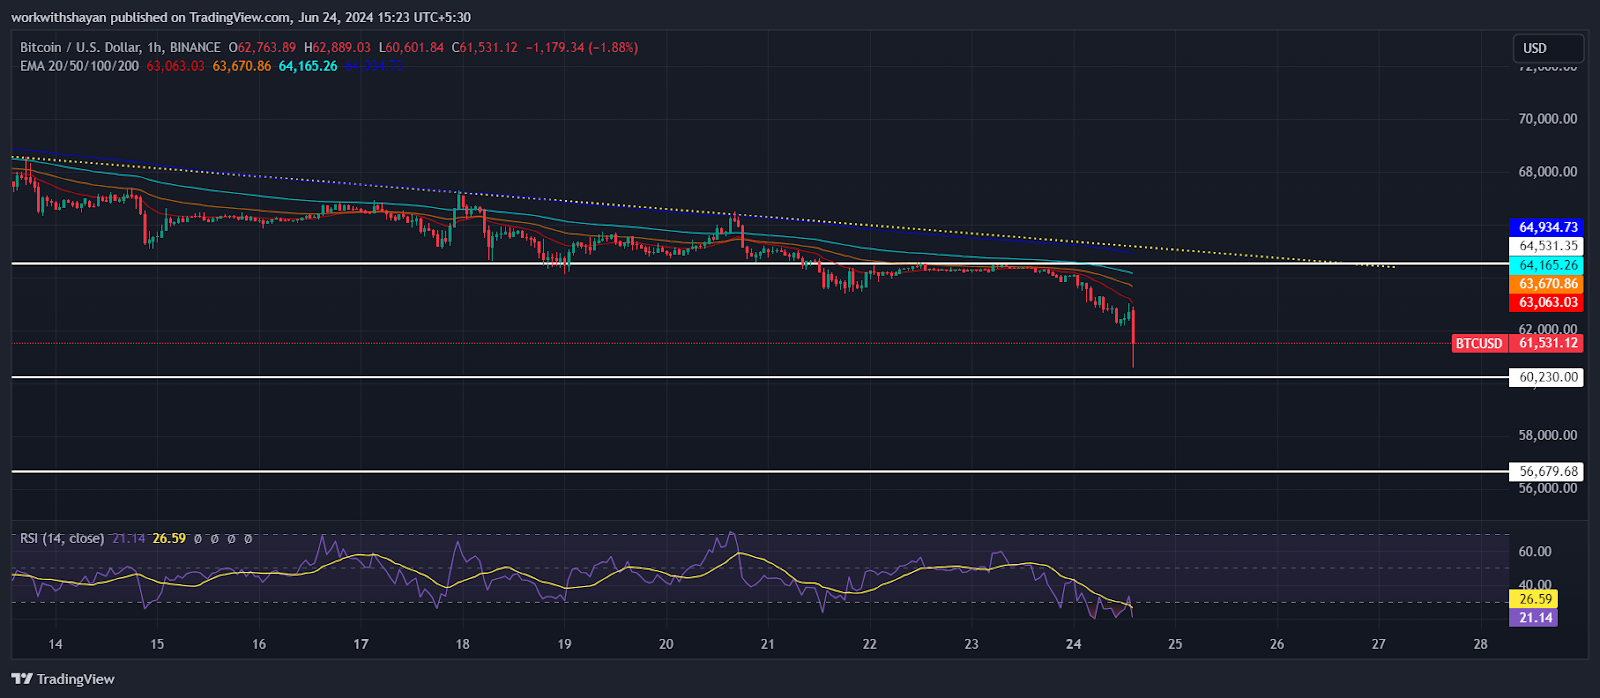
Bitcoin dipped below the $64,500 support, resulting in a strong bearish momentum in the price chart. As a result, the price broke below several Fib levels and declined from $61K in recent hours. Currently, BTC price is trading at $60,800, declining over 5.2% in the last 24 hours.

For bulls to regain control, they must push the price above the moving averages. This could send the BTC/USDT pair towards $63K and then $64,500, though strong resistance is anticipated around $65K-$66K.
Conversely, a failure to maintain above current levels or the moving averages would signal continued negative sentiment, potentially triggering a deeper correction below $60,000.
On the 4-hour chart, bulls are attempting a recovery, meeting resistance at the 20-EMA. However, sellers are strongly defending the price as they aim for an immediate correction below the $60K mark as selling pressure rises.


