- ADA Holds Key Support Amid Volatility Triggered by U.S. Tariff Policy
- Technical Indicators Signal Weak Momentum Despite Price Rebound
- Liquidation Activity Cools After March Spike as Market Stabilizes
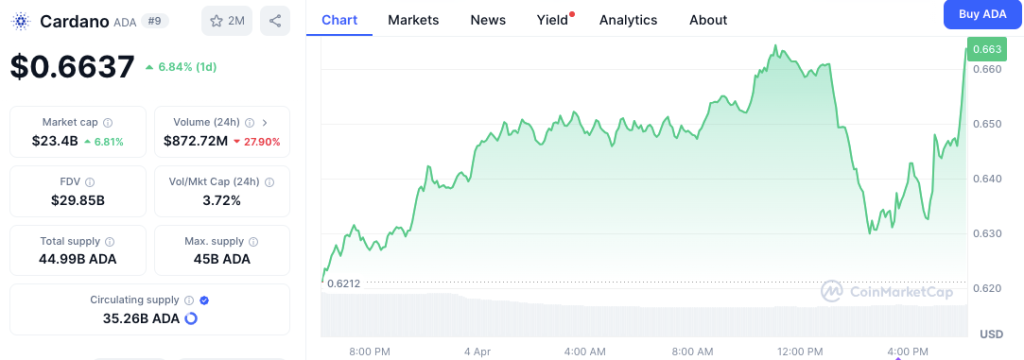
Cardano (ADA) maintained stability above a key support level on April 4, 2025, following a price rebound that analysts linked to technical patterns and broader market conditions. The cryptocurrency experienced a 6.84% daily gain, reaching $0.6637.
This movement came despite a recent decline triggered by geopolitical developments, including a reciprocal tariff policy announced by U.S. President Donald Trump on April 2. While ADA dropped immediately after the announcement, it failed to break below its crucial support, preventing a deeper sell-off.
ADA Rebounds After Brief Downturn
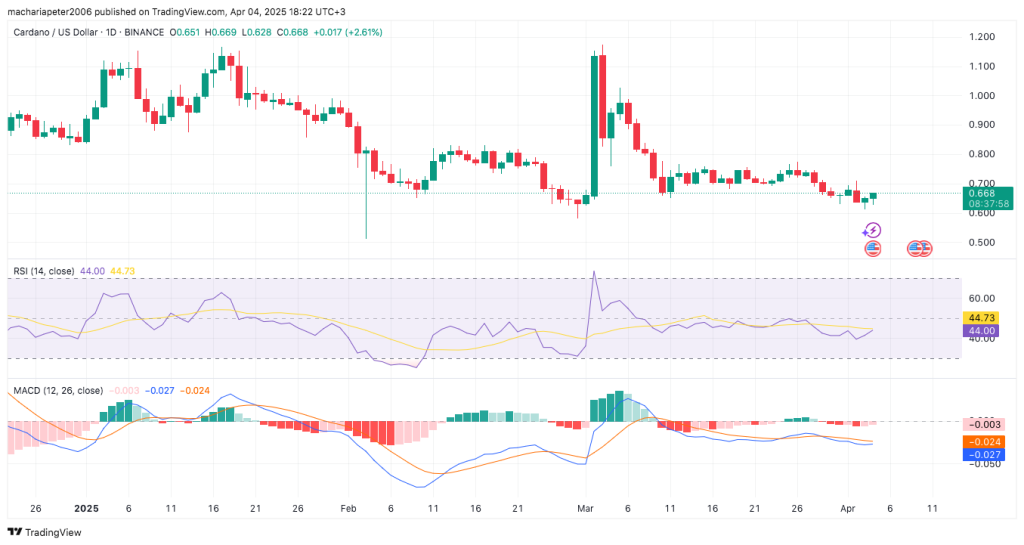
The $0.65 price level also provided stiff resistance during the recent price action. This level formed a bullish hammer candlestick on the daily chart, which is usually considered a sign of a change in direction from bearish to bullish.
Price action showed a low of $0.6212 before rebounding slowly throughout April 4. Intraday volatility occurred during the mid-session but was followed by a sharp recovery, placing ADA near its daily high of $0.663.
Market data from CoinMarketCap shows ADA’s market capitalization grew by 6.81% to $23.4 billion, keeping it in ninth place among cryptocurrencies by market cap. However, despite the price gain, the 24-hour trading volume fell by 27.90% to $872.72 million, indicating less activity during the rise.

The volume-to-market cap ratio stood at 3.72%, suggesting moderate liquidity conditions. Cardano’s fully diluted valuation reached $29.85 billion, with 35.26 billion ADA in circulation out of a maximum supply of 45 billion.
Indicators Reflect Weak Momentum Despite Price Increase
Technical indicators remained mixed, showing limited short-term momentum despite the price jump. The Relative Strength Index (RSI) registered at 44.00, just under its signal line at 44.73. This level places ADA in a neutral range, neither oversold nor overbought. A move above the 50-mark would be necessary to support further bullish momentum.

Likewise, the MACD indicator showed a trending continuation of the theme of caution on its chart. The MACD line was -0.027, below the signal line -0.024 of the MACD indicator. The result of the histogram was slightly negative at – 0.003.
Liquidations Declined After Early March Volatility
The volume of liquidations that Cardano carried over several months is also notable. Analyzing the Coinglass data, it was noticed that there was a sharp increase in liquidations at the beginning of March, specifically on the 5th of March.
ADA was at $0.53 at that point, and the liquidation of longs hovered past $32 million. However, the previous rise above the $0.60 mark in December 2023 must have negatively affected short traders.

Since mid-March, liquidation events have moderated. Current levels show subdued activity in both long and short positions, aligning with ADA’s relatively stable price action in early April.
Frequently Asked Questions
What caused Cardano’s (ADA) recent price rebound on April 4, 2025?
ADA rebounded after forming a bullish hammer candlestick at the $0.65 support level. This technical pattern signaled a possible shift toward upward momentum.
How did trading volume react to ADA’s price increase?
Despite ADA’s 6.84% price gain, its 24-hour trading volume dropped by 27.90% to $872.72 million. This indicates reduced trading activity during the rally.
What do current technical indicators say about ADA’s short-term trend?
The RSI and MACD both suggest weak momentum, with ADA in a neutral zone. A stronger bullish trend would require a break above the RSI 50 mark and a MACD crossover.


