Last week, U.S. stock markets continued to rise despite Federal Reserve Chair Jerome Powell indicating that a rate cut in March was unlikely. Nonetheless, Powell did mention the possibility of a rate cut occurring later in the year. These statements were reiterated in his interview on the CBS news show 60 Minutes.
The combination of remarks from the Fed and robust macroeconomic indicators led to a shift in expectations for future rate cuts by the Fed. Predictions now suggest a reduction of 120 basis points in 2024, a decrease from the previously anticipated 150 basis points at the end of the previous year, as indicated by Fed funds futures. As a result, the U.S. dollar Index (DXY) reached its highest level in 11 weeks.

Bitcoin traditionally exhibits an inverse relationship with the U.S. dollar, meaning the recent surge in the dollar’s value might pose challenges for Bitcoin in the short term. On a brighter note, for Bitcoin supporters, there was a significant increase in investments into BlackRock and Fidelity’s spot Bitcoin exchange-traded funds (ETFs) in January, amounting to approximately $4.8 billion. This sustained investment in the ETFs could help mitigate potential declines in Bitcoin’s value.
The question arises: Will Bitcoin continue to fluctuate within a specific range, or is it poised for a significant breakout? Additionally, how will other emerging altcoins react in this market scenario? To understand this better, a detailed analysis of the market charts is required.
Bitcoin (BTC) Price Analysis
Despite multiple attempts, the bears have been unable to drive Bitcoin’s price below the 20-day Exponential Moving Average (EMA), which is currently at $42,874. However, bulls have also been unable to break the resistance channel at $43.8K. Currently, *BTC* trades at $42,994, surging over 0.06% from yesterday’s rate.

The buyers are likely to attempt pushing the price towards the overhead resistance zone, which lies between $43,800 and $44,700. This range is crucial for the bears to maintain control. Should they fail, the BTC/USDT pair might surge towards the resistance line of $47K.
Conversely, if the price declines from the current level and drops below immediate Fib channels, it might result in the pair entering a period of bearish consolidation within a narrow range. If the bears succeed in pushing the pair below $41,000, a further decline could be seen, potentially leading the price to test $40,000 and possibly even down to $38,000.
Chainlink (LINK) Price Analysis
Chainlink is currently experiencing a significant struggle between buyers and sellers around $20. Bears are strongly defending a surge above immediate Fib channels. Currently, LINK price trades at $19.14, surging over 2.58% in the last 24 hours.

Buyers are currently attempting to send the price above the fear zone of $20, which might trigger a smooth bull run for the *LINK*. While there is a smaller resistance at $22, it’s expected that this level might be surpassed.
On the flip side, if the price falls below the moving averages and stays there, it would indicate that the buyers are losing their grip. In such a scenario, the LINK/USDT pair might begin to decline towards $17.3. This level is crucial for the buyers to defend because if it’s breached, the next significant support could be at $15.
Ripple (XRP) Price Analysis
The bulls were unsuccessful in keeping XRP’s price above the moving averages, which led to the formation of a descending resistance line. However, bulls continue to defend the support of $0.49.

If the *XRP* drops below $0.5-$0.49, it will indicate a surge in selling pressure, resulting in a plunge toward $0.46.
On the contrary, a price rebound from the current level and a subsequent break above the 20-day EMA would indicate strong defense of the $0.50 support by the bulls. This might send the XRP price above the descending resistance, consolidating it near $0.55.
Celestia (TIA) Price Analysis
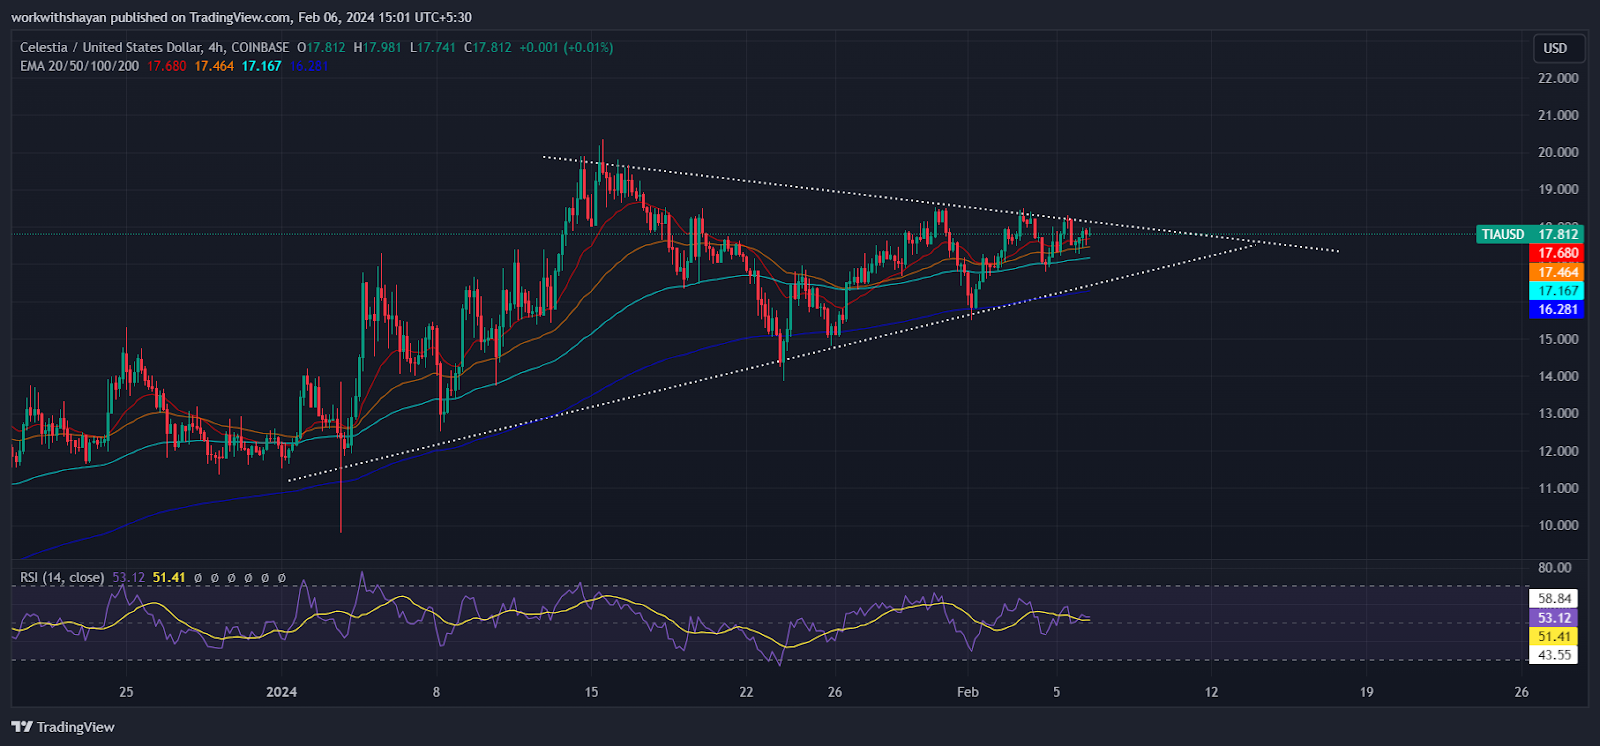
The price of TIA experienced a bullish surge after buyers successfully defended the price above the $16 mark. In the past 24 hours, TIA’s price has followed a bullish trajectory, with continued accumulation by buyers pushing it towards the channel’s resistance line. At the time of writing, TIA is trading at $17.8, representing a decrease of over 1.7% from the previous day’s value.

However, there is a possibility of encountering significant selling pressure around the $18-$20 zone, which could potentially lead to a drop in TIA’s price. If the buyers manage to sustain the price above this level, TIA might maintain its upward momentum. It’s important to note that a fall below the ascending support line could push the Relative Strength Index (RSI) into the oversold territory, thereby intensifying the selling pressure.
COTI Price Analysis
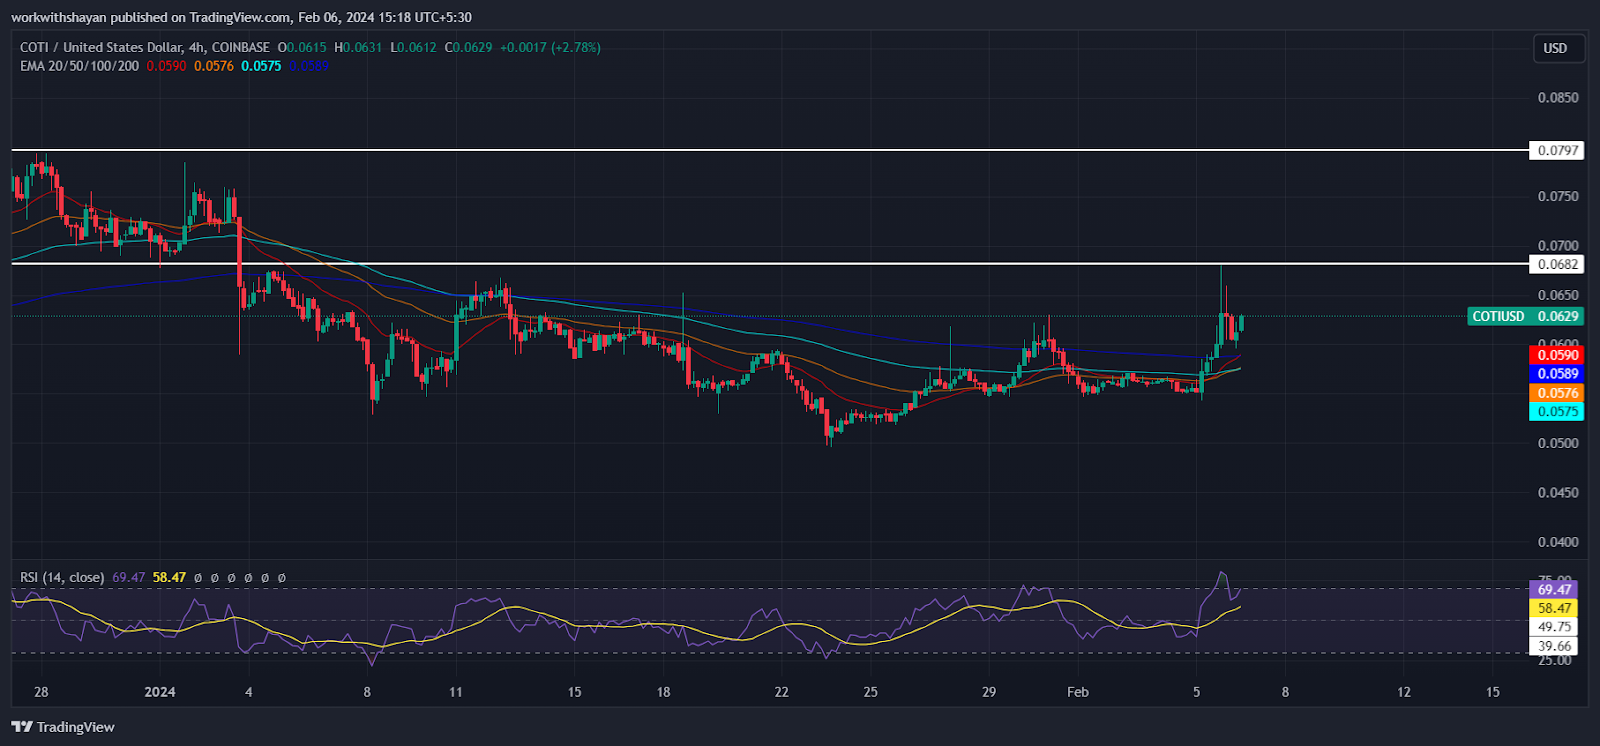
Coti price has been pumping hard in the last 24 hours as buyers touched a peak of $0.068. However, bears defended that level strongly, resulting in a minor correction.

For buyers to negate the bearish pressure, they must overcome the resistance at the $0.0682 level. Successfully doing so could lead the COTI/USDT pair to climb towards $0.079, and possibly extend its rally to $0.09.
Conversely, if the price reverses its course and falls below the 20-day Exponential Moving Average (EMA), it would suggest that bears are capitalizing on smaller rallies to sell. This scenario could see the pair descending towards a key support level at $0.056. A breach of this support level would complete the bearish formation, potentially triggering a decline to the $0.05 mark.


