
Bitcoin’s resurgence appears to falter around the $70,000 mark, yet optimistically, the bulls maintain their stance against the bears. Laurent Benayoun, CEO of Acheron Trading, is optimistic about the ongoing bull market’s potential, predicting it could peak between $120,000 and $180,000. This optimism is supported by factors including the advent of Bitcoin exchange-traded funds, the anticipated Bitcoin halving event, and a possible decrease in interest rates.
Echoing this positive sentiment, Matthew Hougan, the chief investment officer at Bitwise, advised investment experts in a memo to remain composed and adopt a long-term perspective. Hougan argues that a mere 1% allocation of global wealth managers’ portfolios to Bitcoin could lead to a significant capital influx of around $1 trillion into the market.
Despite various factors that could potentially fuel Bitcoin’s upward trajectory in the second quarter of 2024, trading entity QCP Capital has warned that the recent trend appears to be losing momentum, potentially making it difficult for the bulls to sustain the rally.
As the *BTC* halving event is now a few days of waiting, will Bitcoin and other cryptocurrencies face a correction shortly, or is their upward movement set to continue? To determine this, we’ll dive into the technical analysis of the charts for the top 5 cryptocurrencies.
Bitcoin (BTC) Price Analysis
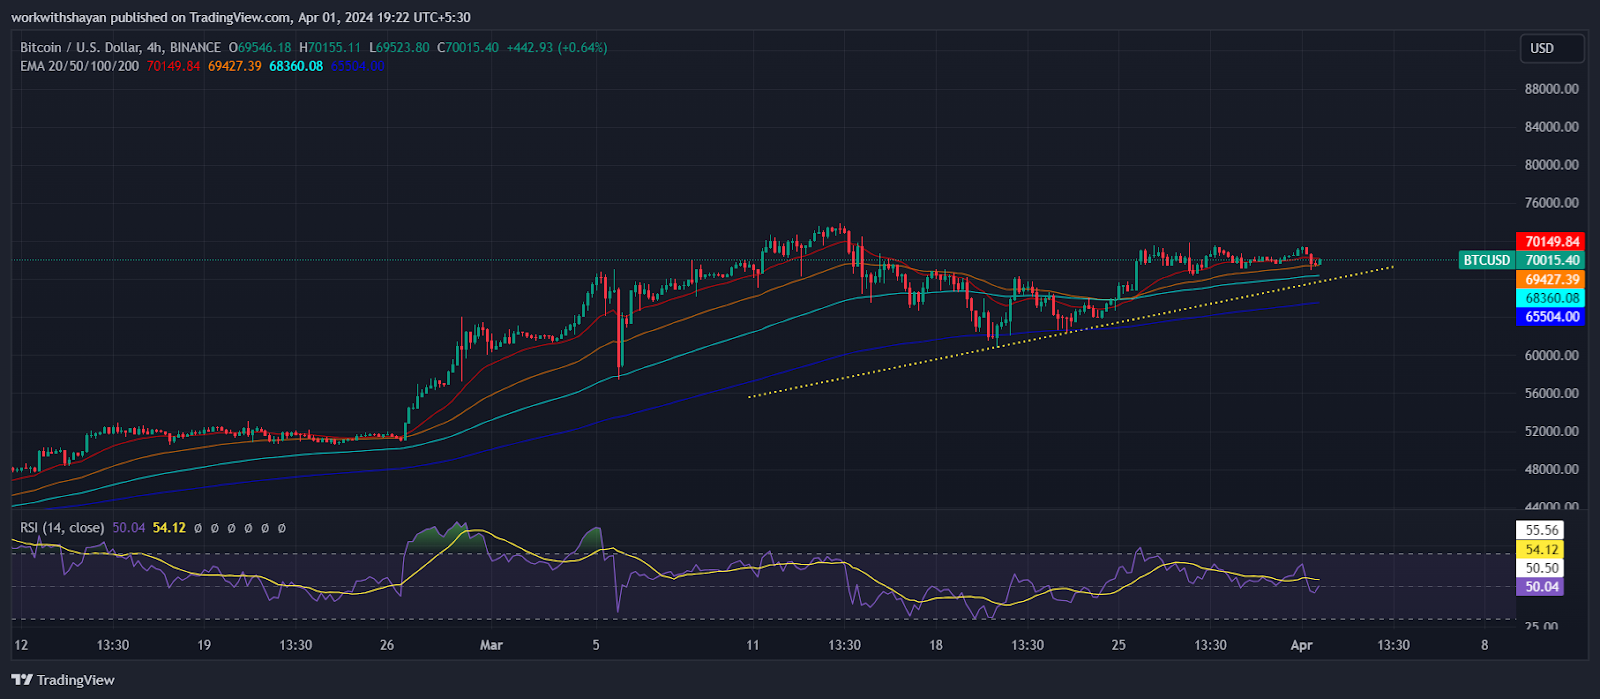
Bitcoin has recently been fluctuating within a narrow margin between $71,748 and $68,557, indicating a standoff between buyers and sellers. There has been an intense battle between traders to validate a clear price trend for Bitcoin.
BTC/USD Chart On TradingView
Typically, such a narrow range of movement near peak prices is seen as a positive indicator, suggesting that buyers are maintaining their positions rather than quickly selling off. This sentiment is supported by the neutral trend of the 20-day exponential moving average (EMA) at $70,100 and the Relative Strength Index (RSI) around the midline, hinting at an equilibrium in the market.
Should the BTC/USDT pair break through the resistance zone ranging from $71.7K to $74K, it could potentially trigger a surge towards the $80,000 mark.
Conversely, a downturn that pushes the price below the 20-day EMA would suggest that buyers are taking profits, potentially leading the pair to drop towards the 50-day simple moving average (SMA) and below the uptrend line at $63K.
Jito (JTO) Price Analysis
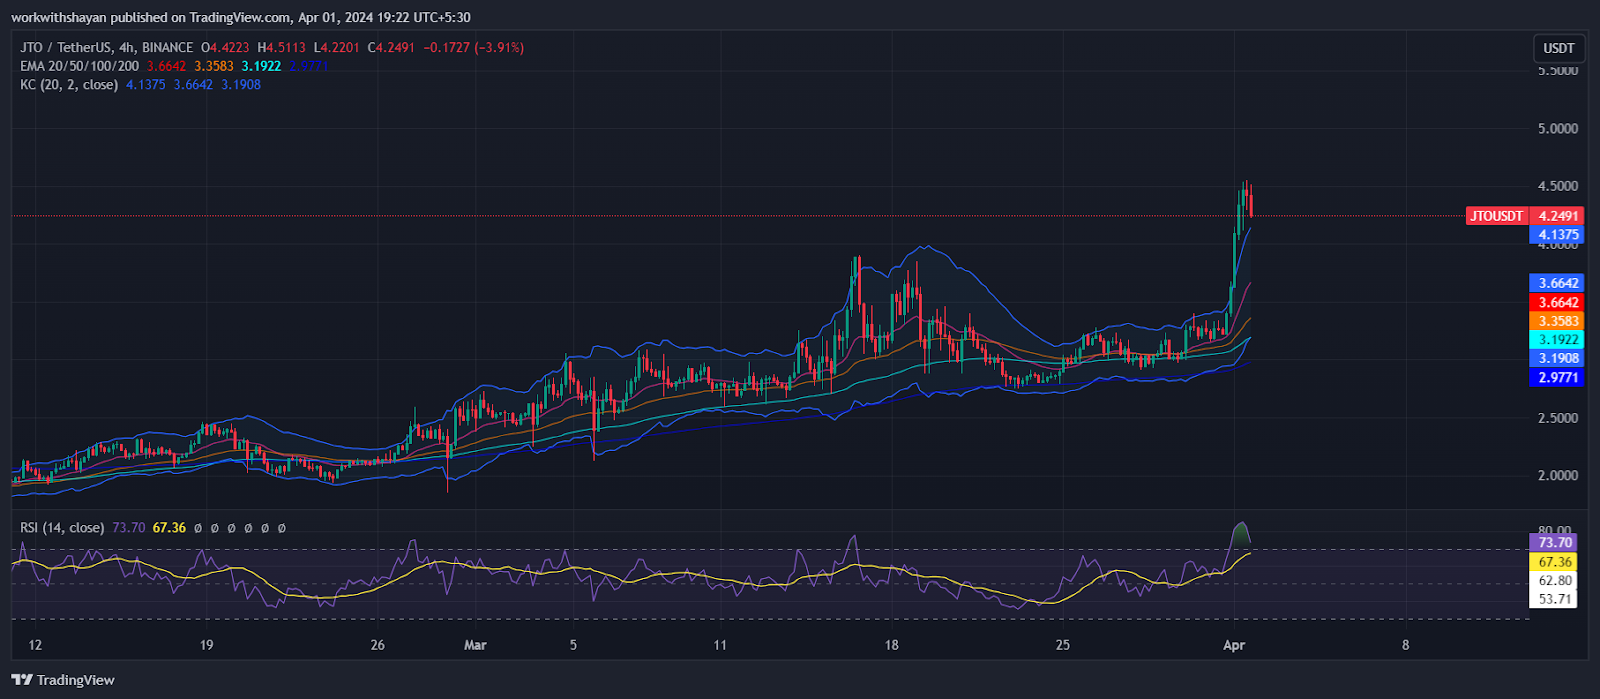
After hovering around the 61.8% Fibonacci retracement mark at $3.3 for several days, JTO finally surged upward and broke through immediate resistance channels. As of writing, JTO price trades at $4.4, surging over 34.5% in the last 24 hours.
JTO/USD Chart On TradingView
Should the price remain above $4.5, the JTO/USDT pair may aim for the next resistance at $5. While this might pose a challenge, a breakthrough could signal the beginning of another upward phase towards new ATH toward $6.
The window for the bears is closing. To stage a recovery, they must vigorously protect the $5 mark and pull the pair beneath the 20-day EMA of $3.6. This could trigger a significant drop to $3.
Axelar (AXL) Price Analysis
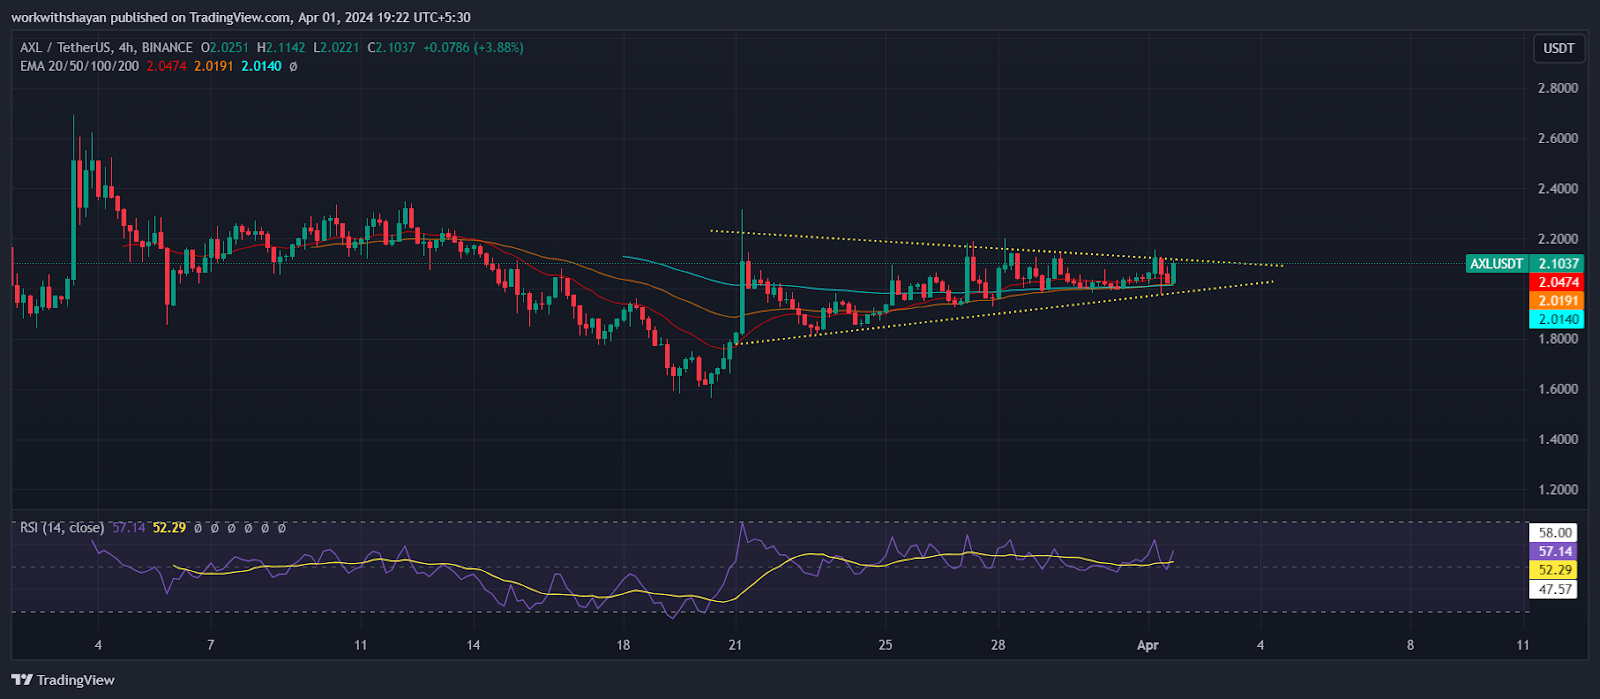
AXL price has hovered around the 20-day Exponential Moving Average (EMA) priced at $2 for several days, signaling indecision regarding its next move. Despite multiple bearish attempts, bulls have been successful in maintaining the price above EMA trend lines. As of writing, AXL price trades at $2.06, surging over 0.74% in the last 24 hours.
AXL/USD Chart On TradingView
Should the price drop below the 20-day EMA, the AXL/USDT pair might decline towards the uptrend line, a critical juncture for buyers to uphold. A fall below this level may shift the momentum towards sellers, potentially driving the price down to $1.5.
The nearly horizontal 20-day EMA combined with the Relative Strength Index (RSI) positioned near the center reflects an equilibrium between sellers and buyers. If buyers manage to push the price above $2.2, it could tilt the scales in their favor, potentially initiating a surge towards the significant resistance level at $2.6.
Solana (SOL) Price Prediction
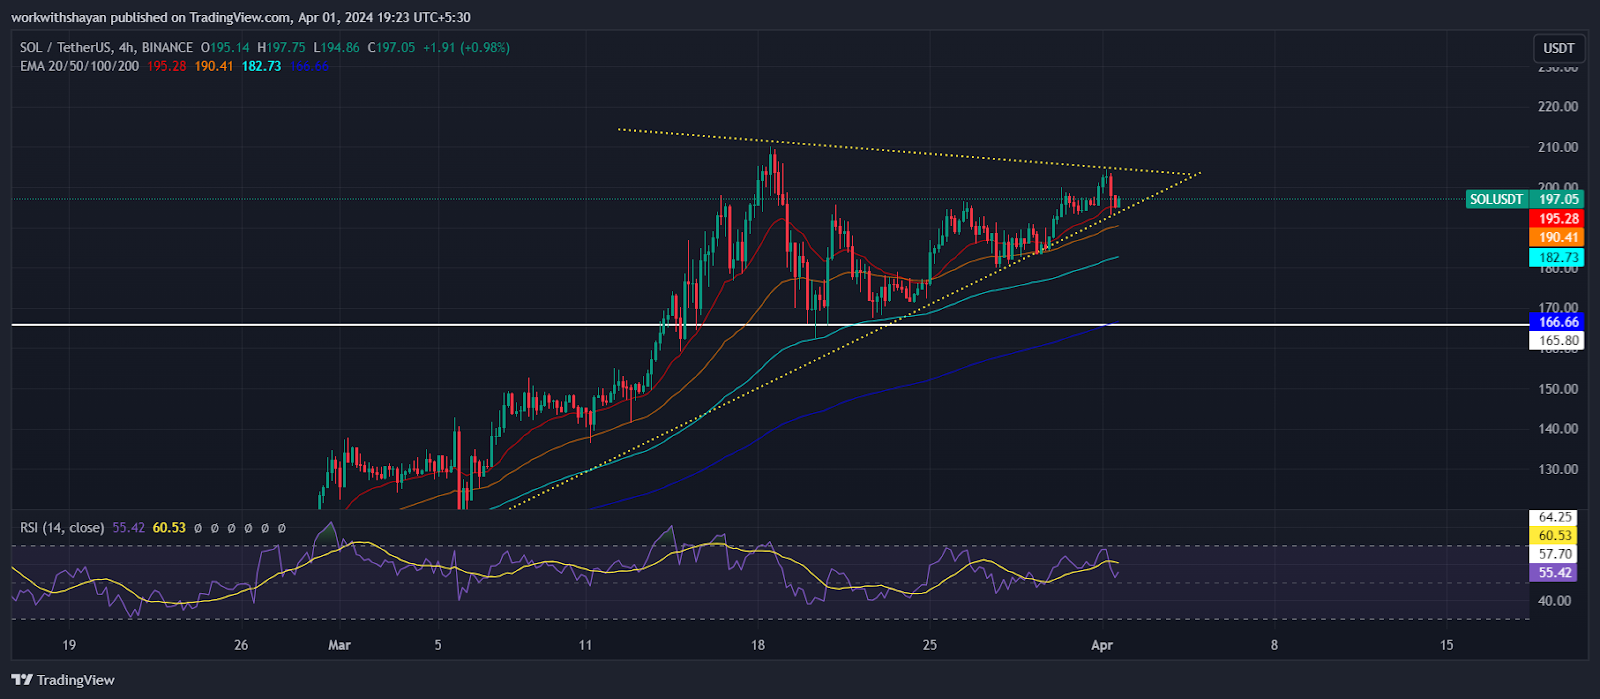
Solana is encountering resistance along the declining trend line, indicating that sellers are attempting to regain control. Though bulls are attempting to send the price below the uptrend line near the support channel, buyers are defending a drop. As of writing, SOL price trades at $197.4, surging over 0.16% in the last 24 hours.
SOL/USD Chart On TradingView
Should the price reverse and drop beneath the 20-day exponential moving average (EMA) at $195, this would shift the short-term momentum to favor the sellers. In this scenario, the *SOL* trading pair might decline to $165, and possibly further to the 50-day simple moving average (SMA) at $140.
For the bulls to avert further losses, they need to send the price beyond the declining trend line. Following this, the pair would seek to overcome the substantial resistance at $210. Achieving this could mark the beginning of the next upward phase towards $250.
Dogecoin (DOGE) Price Analysis
Dogecoin has experienced a slight decline within its upward trajectory, indicating that investors are securing profits as it approaches the resistance level at $0.23. However, buyers have successfully prevented a drop by holding the price above the 23.6% Fib level at $0.19.
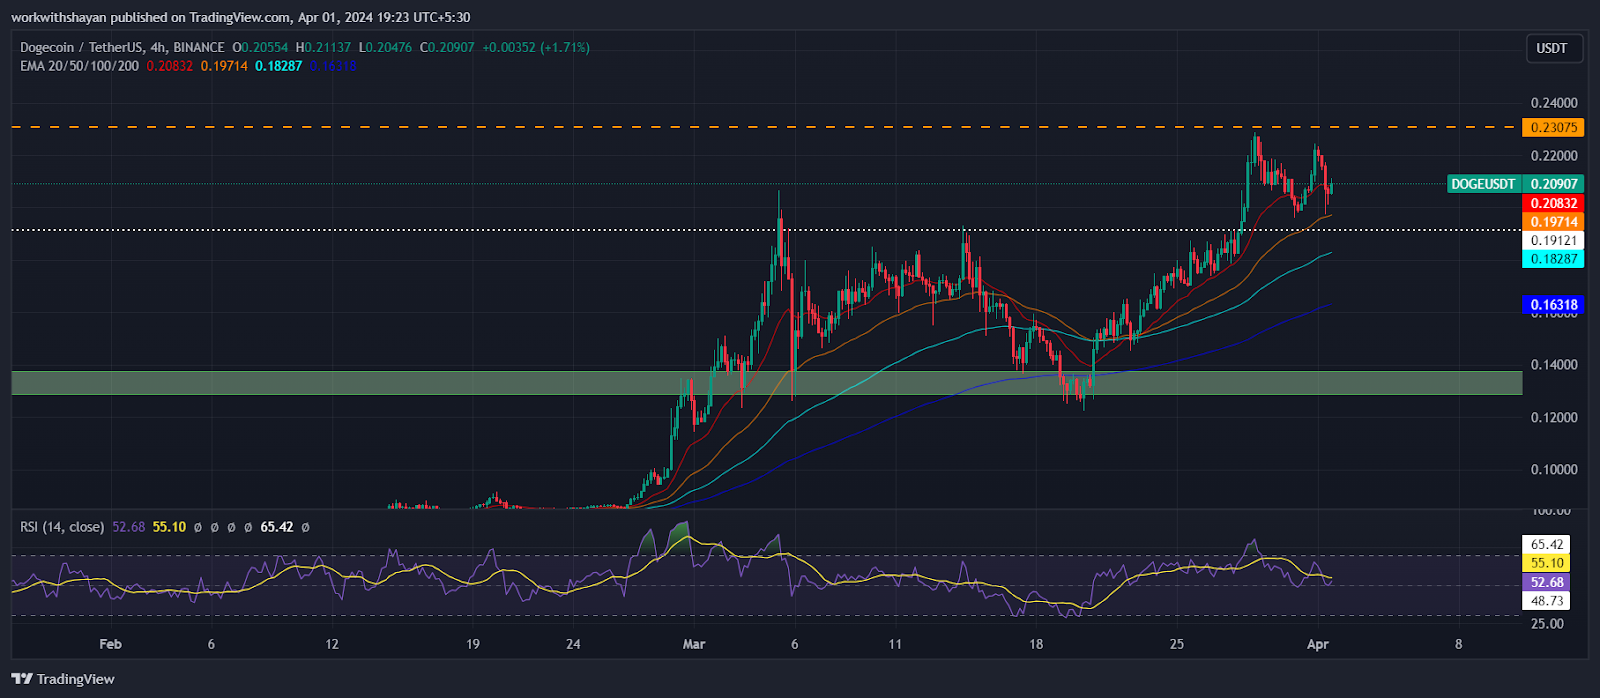
DOGE/USD Chart On TradingView
The *DOGE* trading pair might see a retracement to its breakout point of $0.19. Should the price bounce back from this level, it would demonstrate that buyers have successfully transformed it into a support zone, enhancing the chances for a surge to $0.30.
However, this bullish scenario becomes less likely if the price falls below $0.19, potentially paving the way for a decrease to the 200-day exponential moving average (EMA) at $0.16. This level is crucial for the bulls to maintain, as a drop below it could lead the pair towards the 50-day simple moving average (SMA) at $0.126.


