Bitcoin is currently in a consolidation phase within an uptrend, reflecting a battle between buyers and sellers. In the short term, sellers seem to have a slight advantage, as historical data from Coinglass suggests that the 14th week of the year usually sees an average decline in Bitcoin prices of 9%.
Amidst this sideways movement, traders’ attention is likely to shift towards the performance of spot *BTC* exchange-traded funds (ETFs), which have been a key factor in driving Bitcoin’s price movements. This interest is partly due to a significant increase in trading volume in March compared to February, as highlighted by Bloomberg ETF analyst Eric Balchunas, with spot Bitcoin ETF volume jumping from $42.2 billion to $111 billion.
However, as the anticipated Bitcoin halving event draws closer, the market faces increasing uncertainty. Independent analyst Rekt Capital points out that this downturn is part of a typical pre-halving correction, which previously led to a 38% decrease in 2016 and a 20% decrease in 2020.
To understand the potential future movements of Bitcoin and other leading altcoins, it’s essential to examine the charts of the top 5 cryptocurrencies for key levels of support and resistance.
Bitcoin (BTC) Price Analysis
The bulls’ repeated inability to push the price beyond $71K might have encouraged short-term traders to give up, leading to a price drop below the 20-day exponential moving average (EMA) of $66,922. As of writing, BTC price trades $66,326, surging over 0.26% in the last 24 hours.

BTC/USD Chart On TradingView
The 20-day EMA is now level, and the relative strength index (RSI) hovers near the middle, suggesting an equal force of supply and demand. However, this balance could shift towards the bears if the price falls below the 50-day simple moving average (SMA) of $63K, potentially triggering a decline to $61K and then further to the 61.8% Fibonacci retracement level at $59,000.
Conversely, a price rebound from its current position above the 20-day EMA could indicate that the BTC/USDT pair might remain in a sideways trend for a while. For a bullish trend to resume, the bulls need to push the price through the resistance zone between $71K and $73,780, aiming for an upward move to $80,000.
Litecoin (LTC) Price Analysis
Litecoin’s price fell below its 20-day Exponential Moving Average (EMA) of $101, signaling a potential weakening in its previously bullish trend. However, bulls are strongly defending a decline below $92. As of writing, LTC price trades at $100.22, declining over 0.42% in the last 24 hours.

LTC/USD Chart On TradingView
The 20-day EMA appears to be leveling off, and the Relative Strength Index (RSI) hovers slightly below the neutral point, suggesting the possibility of sideways movement in the short term. Should the price fail to rebound from its current position, it might approach the ascending support line. To validate an uptrend, buyers need to send the price above $111.
If the price continues to fall and breaches the $92 mark, it’s anticipated to encounter the next significant level at $76. This price point could serve as a robust support zone. However, if selling pressure dominates, the price might further retract to the breakout level of $72.
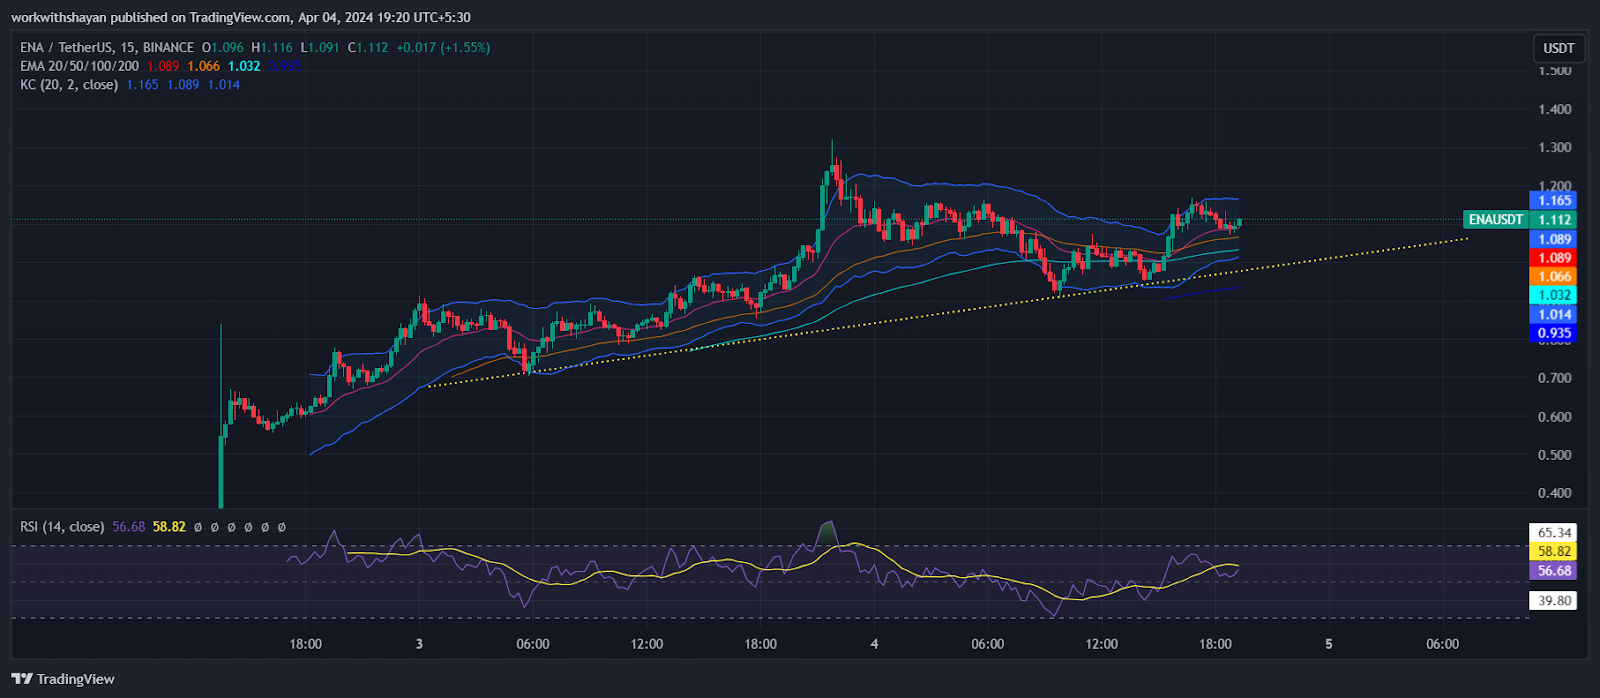
Ethena (ENA) Price Analysis
Ethena’s value has been skyrocketing and has broken through several Fib channels recently. Buyers are currently aiming to drive the momentum upward by sending the price above $1.3.

ENA/USDT Chart On TradingView
The 20-day Exponential Moving Average (EMA) at $1 is beginning to surge, and with the Relative Strength Index (RSI) slightly above the midpoint, it appears that buyers are gaining momentum. A drop below $0.9 might intensify selling activity, potentially leading the ENA/USDT trading pair to plummet to $0.56.
For buyers aiming to halt this decline, driving the price above the moving averages is crucial. Doing so would hint at a possibility of trading within a range from $1.3 to $2. Should the price successfully breach and sustain above $2, it would signal a bullish resurgence, possibly sending the pair towards $2.5.
Wormhole (W) Price Analysis
W price continues decline after facing selling pressure near $1.6, resulting in a rise in bearish dominance. Though bulls continue to prevent a decline, each support line is now being controlled by bears.

W/USDT Chart On TradingView
However, buyers haven’t conceded defeat and are attempting to initiate a recovery rally from $1.1. This rally might encounter resistance at the 20-day exponential moving average (EMA) at $1.14. A reversal from this barrier could increase the chances of a drop below $1. Should this happen, the W/USDT trading pair could further decline to $0.5.
Conversely, if purchasers manage to push the price beyond the 20-day EMA, it would indicate robust buying interest at lower prices. This could send the pair towards $1.3 and potentially to $1.6, marking the principal resistance level to surpass.
Mantle (MNT) Price Analysis
After encountering resistance around the 61.8% Fibonacci retracement mark of $1.2 for several days, MNT eventually broke out upward and touched the $1.4 resistance.

MNT/USDT Chart On TradingView
Should the price remain above $1.4, the MNT/USDT trading pair is poised to approach the next resistance level at $1.9. While this level may present a challenge, a successful breach could signal the beginning of an upward trajectory, potentially reaching $2.1 and then extending to $2.3.
The pressure is mounting on the bears. To stage a comeback, they need to aggressively protect the $1.9 level and pull the pair beneath the 20-day EMA of $1.26. Such a move could trigger a more substantial decline towards $1.


