
Bitcoin experienced a highly volatile trading session on the last day of the quarter as bulls struggled to keep the price above $31,000. However, their efforts were met with a sudden jolt caused by a Wall Street Journal report. The report stated that the United States Securities and Exchange Commission (SEC) had returned applications for the Bitcoin spot-price exchange-traded fund (ETF).
Fortunately, the downside impact was limited as it was revealed that the ETF applications were returned due to a technical issue rather than a fundamental concern. While this temporary setback had a limited effect, it is important to note that any adverse news in the future could still elicit a negative response from market participants. Let’s delve into today’s crypto market analysis to identify the key levels to watch for Bitcoin (BTC), Ethereum (ETH), Ripple (XRP), RichQUACK.com (QUACK), Metatime Coin (MTC), Pepe (PEPE), and BullBear AI (AIBB).
Bitcoin (BTC) Price Analysis
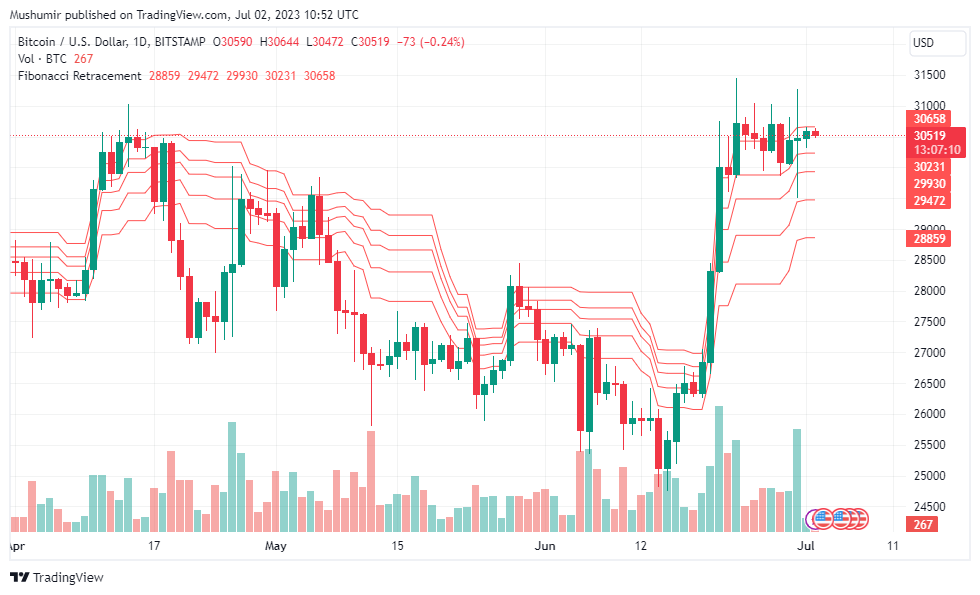
Bitcoin is currently priced at $30,510, showing a 24-hour increase of 0.32%. However, over the last seven days, it has faced a decline of 0.54%. Bitcoin has been consolidating tightly near the overhead resistance level of $31,000, indicating a battle between bears and bulls. The bears are striving to impede an upward movement while the bulls have maintained their pressure.
A tight consolidation near a resistance level typically suggests a potential upward breakout. The presence of an ascending 20-day exponential moving average (EMA) at $28,982 and a positive relative strength index (RSI) further supports the notion that the path of least resistance favors the bulls.
Should buyers manage to sustain the price above $31,000, the BTC/USDT pair could gain momentum and embark on the next leg of its uptrend. While a minor resistance exists at $32,400, it is likely to be surpassed, potentially propelling the pair toward the $40,000 mark. Traders should closely monitor these levels for potential price movements in the coming days.
Ethereum (ETH) Price Analysis
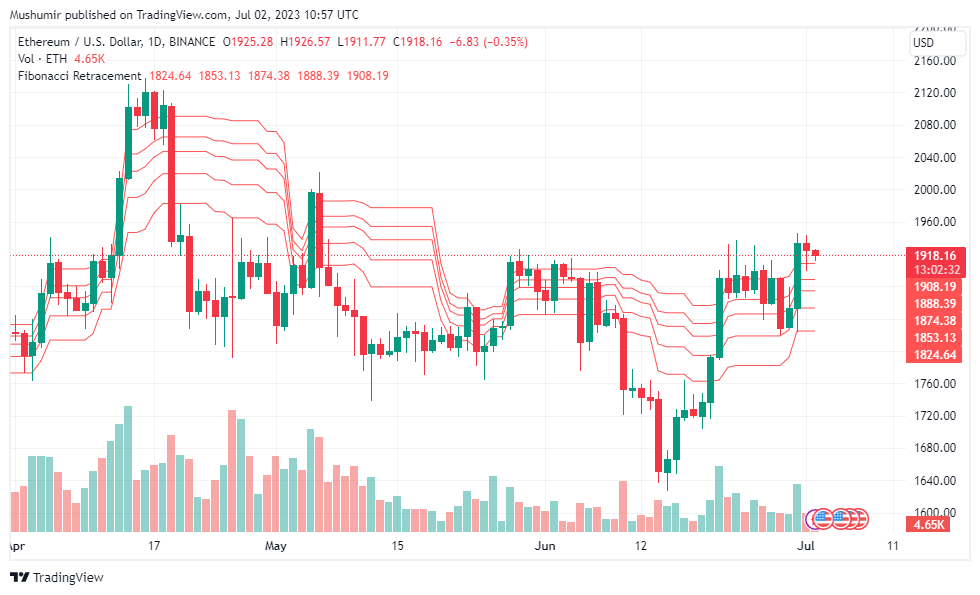
Ethereum is currently trading at $1,918, experiencing a minor uptick of 0.03% in the past 24 hours. Unfortunately, it has dipped by 0.21% in the last seven days. On June 29, Ethereum experienced a rebound from the moving averages, indicating that buyers are being attracted to the lower price levels. The bulls will now aim to push the price above the overhead resistance level of $1,937. If successful, the ETH/USDT pair could ascend toward the psychological barrier of $2,000.
Although this level may initially pose a minor obstacle, it is expected to be surpassed, potentially propelling the pair to rally toward $2,142. However, if the price undergoes a sharp downturn from the $1,937 resistance, it would indicate that bears are unwilling to relinquish control. This scenario would increase the likelihood of a decline below the moving averages. In such a case, the pair could slump toward the support levels at $1,700 and, subsequently, $1,600.
Ripple (XRP) Price Analysis
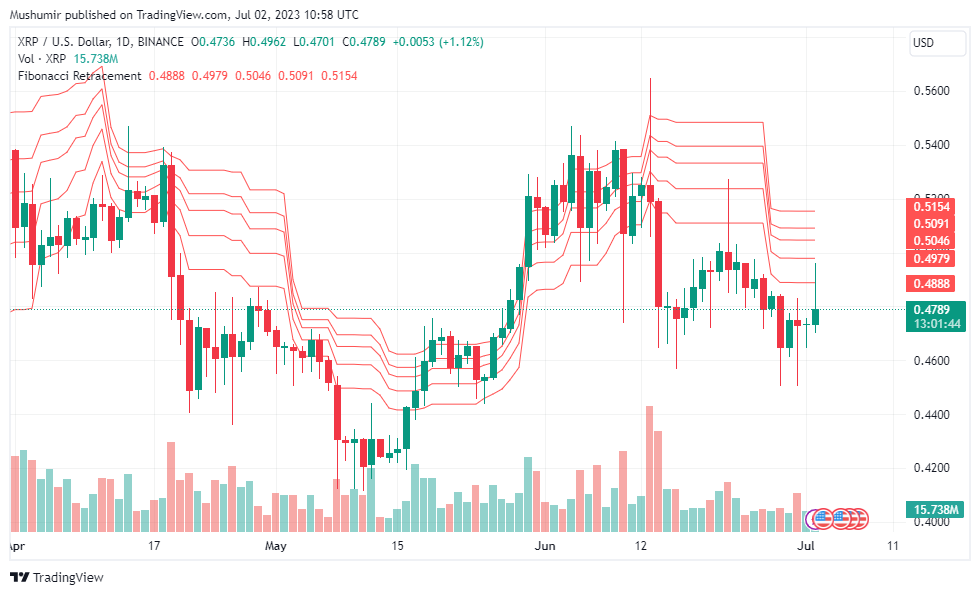
Ripple is currently priced at $0.4789 and has performed relatively well in the past 24 hours, with a notable gain of 2.22%. However, in the last seven days, it has faced a decline of 2.72%. In the near term, keeping a close eye on the $0.44 support level is crucial. A breakdown below this level could intensify selling pressure, potentially causing the XRP/USDT pair to decline further toward $0.41.
However, it is worth noting that this level may attract significant buying interest from the bulls, potentially leading to a bounce back. For the bulls, the 20-day EMA at $0.48 is a key resistance level to overcome. If buyers manage to surpass this hurdle, it would improve the prospects for a rally toward the strong overhead resistance zone spanning from $0.53 to $0.56. This zone represents a significant barrier that will require considerable bullish momentum to be breached.
RichQUACK.com (QUACK) Price Analysis
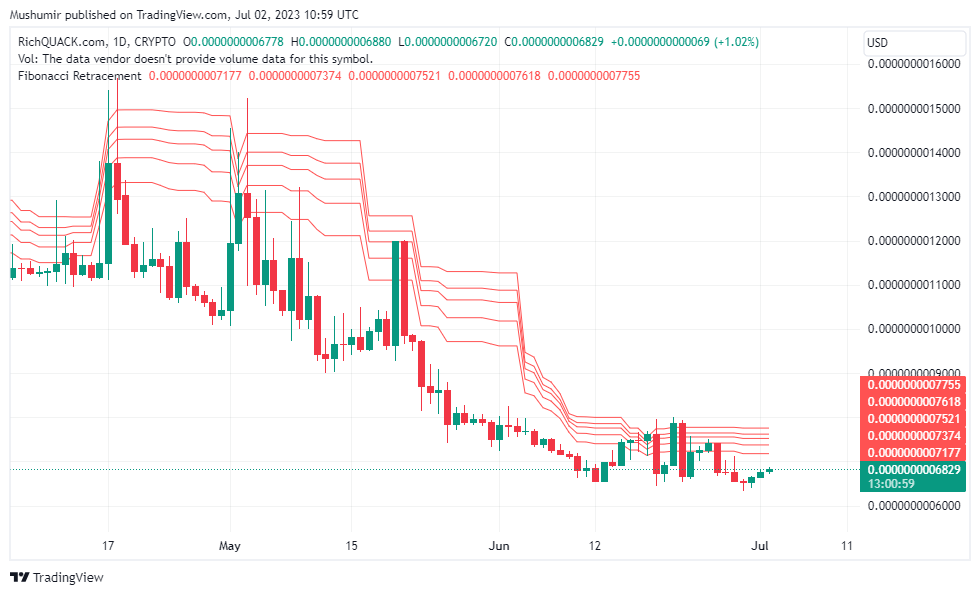
RichQUACK.com is currently priced at $0.0000000007348 and has experienced a significant gain of 6.34% in the past 24 hours. However, it has faced a small decline of 0.29% in the last seven days. As of July 2, 2023, the technical analysis indicators for RichQUACK.com revealed a mixed picture. While some indicators displayed bullish signals, others indicated bearish signals, pointing to a general sentiment of uncertainty in the market for QUACK.
The conflicting signals from various technical indicators highlight the challenge of accurately predicting the market direction for QUACK. Traders and investors should exercise caution and closely monitor the market conditions to make informed decisions amidst the prevailing market uncertainty.
Metatime Coin (MTC) Price Analysis
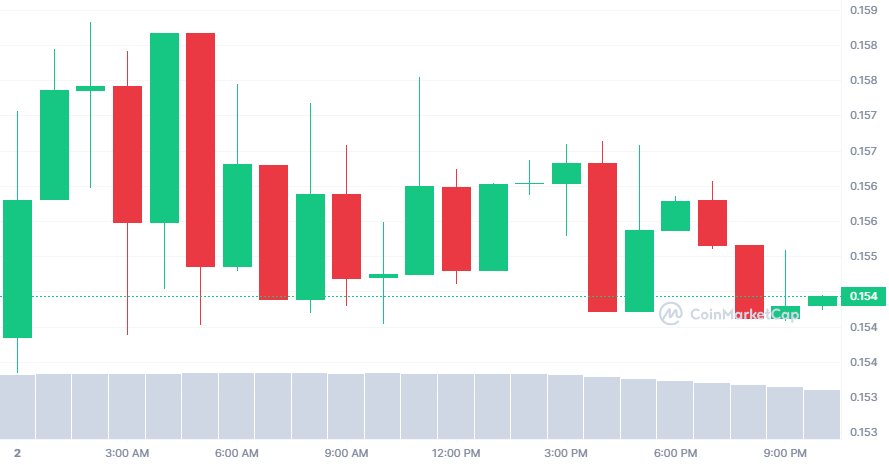
Metatime Coin is currently priced at $0.1544 and has experienced an increase of 1.43% in the past 24 hours. Over the last seven days, it has faced a decline of 2.34%. Over the past few days, the coin has displayed volatile price movements, indicating a degree of risk. However, upon comparing the current MTC price with the price history of the past 30 days, we have observed a remarkable 98.521% increase in the value of Metatime Coin.
The average monthly minimum price was $0.002, while the maximum average price reached $0.002. This suggests that the coin could be a suitable long-term asset and a valuable addition to your portfolio. Furthermore, over the course of 90 days, the price of the coin has experienced an approximately 98.85% change, ranging from a minimum average price of $0.002 to a maximum average price of $0.002. Traders and investors should consider these technical indicators when making decisions related to Metacoin.
Pepe (PEPE) Price Analysis
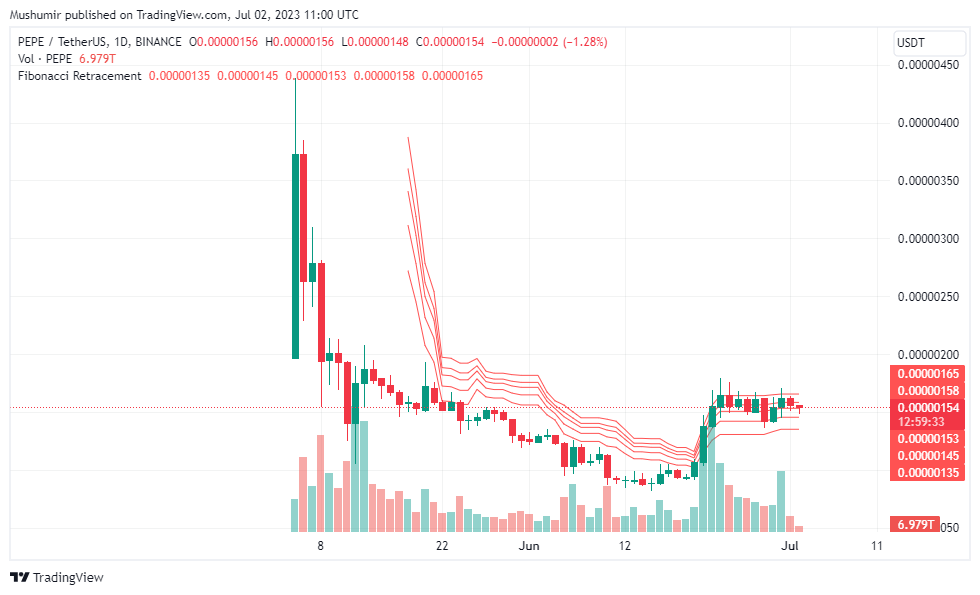
Pepe, currently priced at $0.000001546, has experienced a decline of 1.80% in the past 24 hours. Over the last seven days, it has faced a decrease of 3.43%. It is apparent that the PEPE price currently rests below the 50 MA (short-term), indicating a downtrend. Consequently, PEPE is considered to be in a bearish state. However, it is important to note that market trends can reverse, and a potential trend reversal could occur in the future.
Traders and investors should closely monitor the price movements and additional indicators to assess the potential for a trend reversal in PEPE. It is recommended to conduct a thorough analysis and stay updated with market developments to make informed decisions regarding this cryptocurrency.
BullBear AI (AIBB) Price Analysis
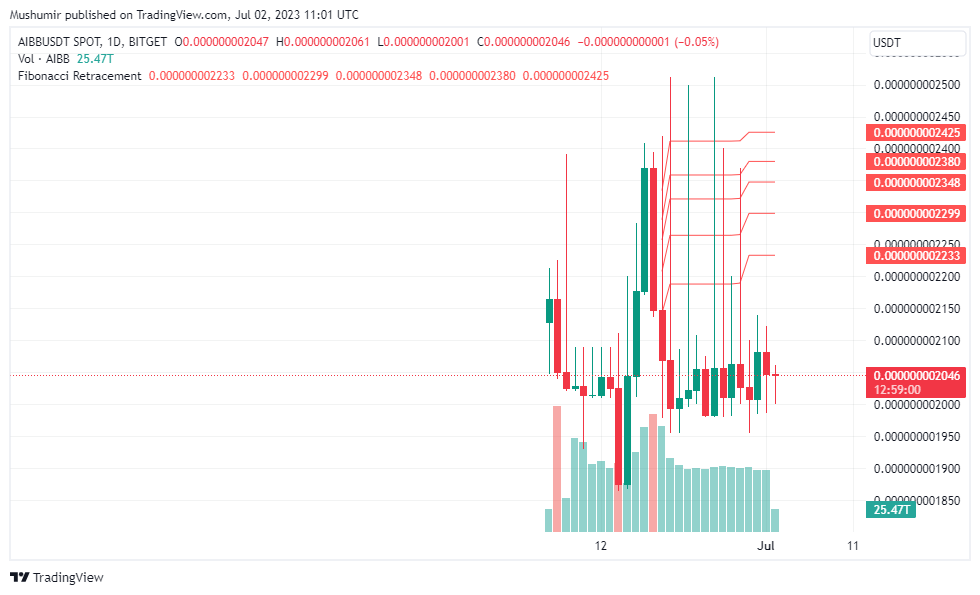
BullBear AI (AIBB) is currently priced at $0.000000002046, experiencing a marginal increase of 0.34% in the past 24 hours. However, over the course of the last seven days, AIBB has encountered a decline of 0.57%. These small fluctuations in AIBB’s price movement indicate a relatively stable performance in the face of a volatile market.
The minor gains and losses in AIBB’s price demonstrate that it has managed to maintain a level of stability compared to other more volatile cryptocurrencies. While the recent decrease over the past week may raise some concerns, it is important to consider the broader market conditions and factors influencing AIBB’s price.


