Over the past few days, XRP has been in a consolidation phase following a period of heightened volatility. Currently trading at around $2.6876 USD, XRP experienced a 1.49% dip in the last 24 hours—a mild retracement that many analysts interpret as a healthy pullback within an overall bullish framework.
Recent intraday data reveal that XRP’s price has fluctuated between approximately $2.65 USD (its recent low) and $2.73 USD (its recent high). This relatively narrow trading range suggests that the market is currently balanced, with buyers and sellers in near equilibrium. Such consolidation is common in mature markets and often sets the stage for a breakout once a catalyst—such as positive regulatory news or increased institutional buying—emerges.
XRP Price Analysis
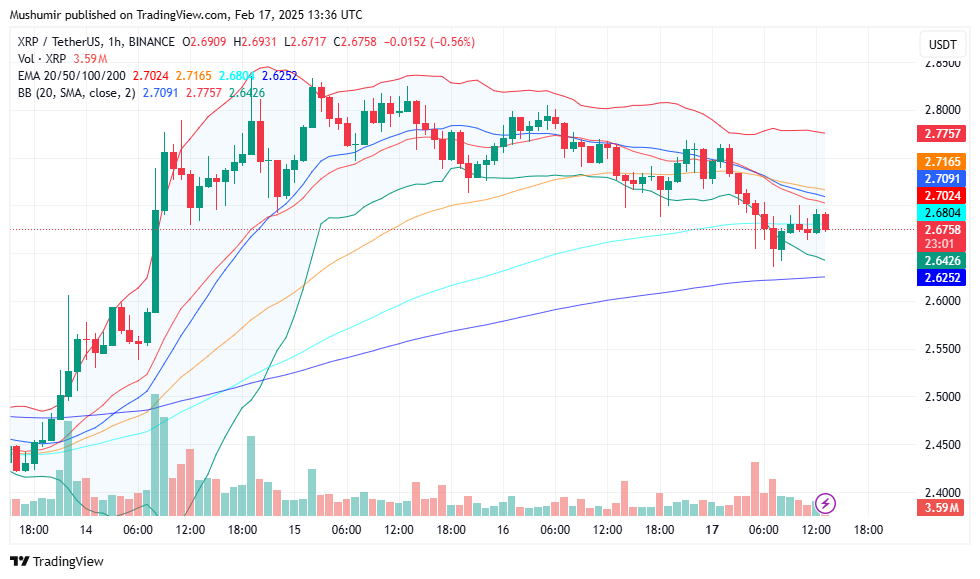
According to recent data from TradingView, XRP’s 50‑day moving average (MA) is currently estimated to be around $2.70 USD, while its 200‑day moving average (MA) is approximately $2.65 USD. Trading near or slightly above these averages is generally considered a bullish sign, indicating that the recent price dip has not disrupted the overall upward trend.
Recent swing lows have formed a support level near $2.65–$2.68 USD, while resistance appears to be forming around $2.73–$2.75 USD. If XRP can hold its support and eventually break above the resistance level, it could signal that buyers are regaining control. Conversely, a break below these support levels might indicate that bearish pressure is intensifying.
The Relative Strength Index (RSI) for XRP is currently in the neutral zone, reading approximately 52–56. This neutral RSI suggests that XRP is neither overbought nor oversold, leaving room for the market to move in either direction based on future catalysts. The Moving Average Convergence Divergence (MACD), when observed on a 4‑hour chart, has started showing early signs of a bullish crossover.
Although the MACD histogram remains compressed—an expected outcome in a narrow trading range—this emerging crossover might serve as a precursor to upward momentum if accompanied by increased trading volume. Currently, XRP’s Bollinger Bands are relatively narrow, indicating low volatility during the consolidation phase. Such a “squeeze” typically precedes a breakout. A decisive move above the upper band (around $2.73–$2.75 USD) would suggest that bullish momentum is building.
Recent trading volumes for XRP have been moderate, which is typical during periods of consolidation. A significant increase in volume as the price approaches key resistance levels would help confirm any breakout signal. Conversely, if volume remains subdued, it may imply that the market is waiting for a significant catalyst before committing to a clear directional move.
XRP Price Prediction
If XRP holds its support near $2.65–$2.68 USD and manages to break above the resistance zone at around $2.73–$2.75 USD, the bullish signals from the MACD crossover and moving averages may drive the price upward. In this case, XRP could rally to a target range of approximately $2.80–$2.85 USD by the end of the day. Increased trading volume near resistance would further validate this bullish move.
In the absence of a strong directional catalyst, XRP is likely to continue trading within its current consolidation range, roughly between $2.65 and $2.75 USD. This outcome indicates that the market remains in a holding pattern as investors await a decisive catalyst that could drive the price in one direction or the other. Should selling pressure intensify and XRP fails to maintain its support level near $2.65 USD, the price could decline further, potentially falling to around $2.60 USD or lower. This outcome would signal that bearish sentiment is prevailing, at least in the short term.
Given the current technical environment—characterized by a neutral RSI, early bullish MACD signals, and moderate trading volume—the most balanced short-term XRP price prediction for February 17, 2025, is that XRP will likely trade within its current range. However, if buyer interest strengthens, XRP could see a modest rally, pushing the price toward $2.80–$2.85 USD.
Frequently Asked Questions (FAQs)
What is the price prediction for XRP on February 17, 2025?
Based on our technical analysis, XRP is expected to trade between $2.65 and $2.75 USD on February 17, 2025, with the potential for a modest rally pushing the price to about $2.80–$2.85 USD if bullish momentum builds.
How has XRP performed today?
Recent performance indicates that XRP has experienced consolidation after a period of volatility. Currently trading at approximately $2.6876 USD after a 1.49% dip, XRP’s intraday range has been narrow, with lows around $2.65 USD and highs near $2.75 USD, reflecting balanced market sentiment as investors await further direction.
Where can I buy XRP, and what is today’s forecast price?
XRP is widely available on major cryptocurrency exchanges such as Binance, Coinbase, Kraken, and Bitstamp. The current short‑term forecast suggests that if XRP holds its support near $2.65 USD and breaks above resistance near $2.73–$2.75 USD, it could rally to a target range of $2.80–$2.85 USD today. Otherwise, it is likely to remain within its consolidation range.
Investment Risk Consideration
Investing in cryptocurrencies such as XRP involves inherent risks due to their high volatility and sensitivity to market sentiment. Investors should conduct thorough research, diversify their portfolios, and employ robust risk management strategies when trading or investing in volatile assets like XRP. It is advisable to consult with financial professionals before making any investment decisions.


