


- 1. Ether Lost 12% in a Week and Still Beat Bitcoin
- 2. Three Lows Between $1,710 and $1,750 Have Held
- 3. Perpetual Funding Is Below the Neutral Line
- 4. Open Interest Is Shrinking in Dollars, Not in Coins
- 5. Fear and Greed at 12: What the Index Measures
- 6. The Two Prices That Decide the Next Move
- 7. Frequently Asked Questions
Ether traded at $1,803.26 at 21:53 UTC on November 17, down 1.40% in 24 hours and 12.16% over seven sessions, according to CoinGecko price data. The absolute numbers look worse than the relative ones. Bitcoin fell 12.97% over the same week, so the ETH/BTC ratio ended Tuesday at 0.02805 against 0.02782 on November 10, a 0.8% gain in ether terms while both assets lost double digits in dollars.
That gap is the most useful thing on the screen for anyone trying to decide whether ether is leading this decline or following it. Ether is 18.8% below its 30-day average daily close of $2,221.86, and 28.6% below the 30-day high of $2,526.99. Against bitcoin, it is close to flat over the week and 4.3% lower over the month, having traded at 0.02935 on October 18. Market capitalisation sits at $220.39 billion on $11.86 billion of 24-hour volume, which is 17.1% of bitcoin’s $1.29 trillion.
Ether Lost 12% in a Week and Still Beat Bitcoin
Seven-day performance is where the relative story shows up cleanly. From the November 10 daily close of $2,052.20, ether is down 12.13% to the current $1,803.26. Bitcoin’s equivalent move, from $73,762.90, is a 12.93% decline. Ether gave up 0.8 percentage points less.
The ratio chart makes the same point in a different unit. It peaked at 0.03012 on November 4, fell to 0.02757 on November 14, the lowest close in the 30-session window, and has since recovered to 0.02805. That is a 6.9% drawdown from the November 4 peak and a 1.7% rebound off the November 14 low.
The 30-day view reverses the ranking. Ether is 25.15% below its October 18 close of $2,409.12, while bitcoin is 21.75% below its own. So ether outperformed over one week and underperformed over one month, which is the normal signature of a high-beta asset in a market that has been falling since early November. Our November 8 ETH/BTC ratio reading of 0.0295 now looks like the last print before the ratio broke lower.
Three Lows Between $1,710 and $1,750 Have Held
Intraday lows on Binance’s ETHUSDT perpetual contract, taken from daily candles, tell a tight story. Ether bottomed at $1,726.26 on November 14, at $1,710.01 on November 15 and at $1,750.05 on November 17. Each of those lows sat above the 30-day floor, and each was bought back before the daily close: $1,768.36, $1,834.28 and $1,802.84 respectively.
The November 14 session carried 7.41 million ETH of perpetual volume against a 30-day average of 3.59 million, or 2.06 times normal. That is the one session in the sequence that looks like forced selling rather than drift, and the price has not returned to its $1,726.26 low in the three sessions since.
The overhead side is equally specific. Tuesday’s high was $1,843.16. The seven-session high is $2,135.90, set on November 10, and nothing since has come within 14% of it. That sequence of lower highs is the single clearest bearish structure in the data, and it is not yet broken.
Method note: these levels come from daily candle highs and lows on a 30-session window ending November 17, not from hand-drawn trendlines. A daily close below $1,710.01 would invalidate the floor read, because it would mean those three lows were a pause inside a downtrend rather than a base. A daily close above $2,135.90 would break the lower-high sequence.
Perpetual Funding Is Below the Neutral Line
Binance’s ETHUSDT perpetual carried a funding rate of 0.005485% per eight-hour interval at 21:58 UTC on November 17, according to the exchange’s own funding feed. Binance’s baseline interest rate on the contract is 0.01% per interval. Funding at roughly 55% of that baseline means long positions are still paying shorts, but barely.
Annualised, 0.005485% every eight hours works out to about 6.0% a year, against 10.95% for the neutral baseline. That is the arithmetic of a market where leveraged longs have mostly been cleared out rather than one where a fresh wave of shorts has taken control. The perpetual also traded at $1,802.76 against an index price of $1,803.42, a 0.036% discount — small, but on the wrong side of spot for bulls.
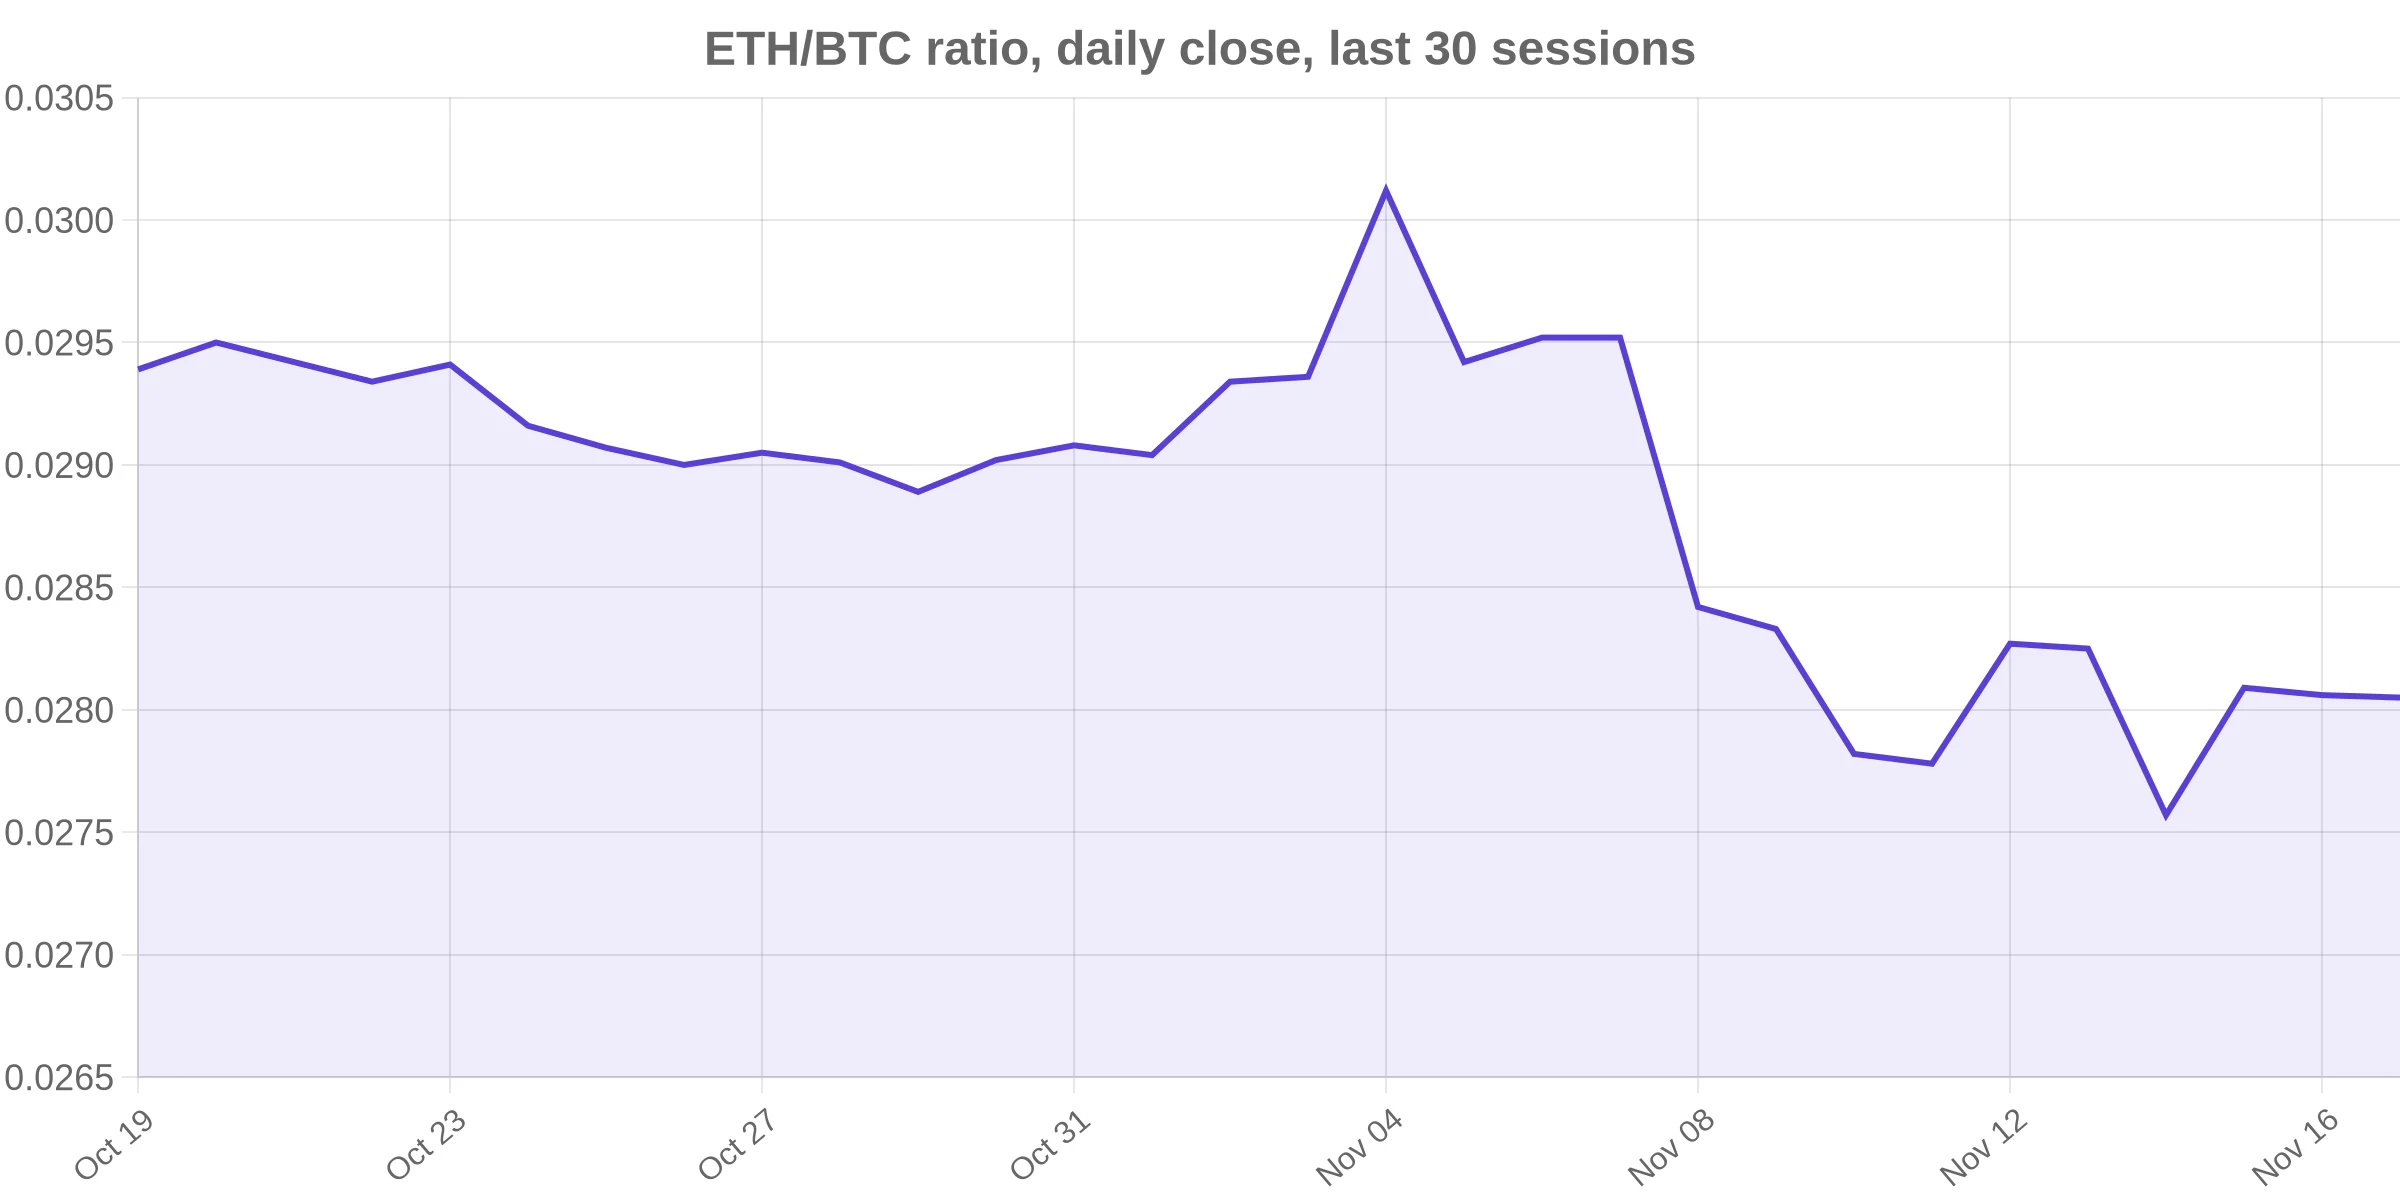
The chart above plots the ETH/BTC ratio’s daily close across the last 30 sessions on Binance data. The November 4 peak and the November 14 trough are the two extremes that frame the current 0.0281 level.
Open Interest Is Shrinking in Dollars, Not in Coins
Open interest on the same contract was 2,284,265 ETH worth $4.157 billion on November 17, against 2,244,061 ETH worth $4.789 billion on November 10. Contracts grew 1.8% while dollar value fell 13.2%. Peak open interest in the window was 2,339,782 ETH on November 13, valued at $4.724 billion.
Divide value by contracts and the implied notional per ETH of open interest falls from $2,134 on November 10 to $1,820 on November 17, a 14.7% drop. That is a mechanical consequence of price, not evidence of new positioning. The coin count barely moved, which argues against a mass exodus from derivatives and against a fresh leverage build. Both readings are consistent with a market that is deleveraged relative to a week ago and waiting rather than committing.
What the data does not establish is why the market fell in the first place. Funding, open interest and the ratio describe positioning; they cannot separate spot selling from derivative hedging from macro reallocation. Any single-cause explanation for the November decline should be treated as a hypothesis until flow data confirms it.
Fear and Greed at 12: What the Index Measures
The Crypto Fear and Greed Index printed 12 on November 17, in the “Extreme Fear” band, its fifth consecutive extreme-fear reading after 20 on November 13, 13 on November 14 and 10 on both November 15 and 16. Before that, November 8 through 12 ranged between 28 and 32 in the “Fear” band.
Five straight extreme-fear prints is a sentiment fact, not a trading signal. The index blends volatility, momentum, social volume, dominance and search trends into a 0-100 number; it says how frightened participants are, not what happens next. Our study of 26 earlier single-digit prints found a median 90-day bitcoin gain of just 1.4%, which is the honest base rate for anyone treating capitulation readings as a buy trigger.
The Two Prices That Decide the Next Move
Two prices matter more than the rest. On the downside, $1,710.01 is the 30-day low and the level that has to hold for the floor argument to survive. On the upside, $2,135.90 is the seven-day high and the first level that would end the pattern of lower highs. Between them, ether has spent four sessions doing very little, which is itself information: the November 14 low of $1,726.26 has not been retested since.
For the ratio, 0.02935 — the October 18 level — is the number to watch. Had the ratio held there while bitcoin traded at $64,226, ether would be at $1,885, about 4.5% above the current price. The 4.3% ratio loss over the month is therefore a bigger drag on ether holders than the 12.16% weekly decline suggests, because most of that decline was the whole market moving, not ether losing ground to bitcoin.
Data: Binance Futures, Alternative.me.
Frequently Asked Questions
What is the Ethereum price today?
Ether traded at $1,803.26 at 21:53 UTC on November 17, down 1.40% in 24 hours, according to CoinGecko. Its market capitalisation was $220.39 billion.
Why is ETH down this week?
Ether is 12.16% lower over seven sessions in a market where bitcoin fell 12.97%. Perpetual funding on Binance sits at 0.005485% per eight hours, below the 0.01% neutral baseline, and open interest in dollar terms fell 13.2% in a week. The derivatives data shows position unwinding, not a single identifiable cause.
What is the ETH/BTC ratio right now?
The ratio closed at 0.02805 on November 17, against 0.02782 on November 10 and a November 4 peak of 0.03012. It is 4.3% below its October 18 level of 0.02935.
What is the key support level for Ethereum?
$1,710.01, the November 15 low and the 30-day low on Binance daily candles. A daily close below it would invalidate the three intraday lows recorded since November 14.
What would signal a trend change for ETH?
A daily close above $2,135.90, the seven-session high set on November 10, would end the sequence of lower highs. Until then the structure remains bearish on the daily timeframe.
This article is for information only and is not investment advice. Cryptocurrency prices are volatile and the levels cited reflect a 30-session window ending November 17, 2026.
About the author
Blockchain analyst specializing in the regulatory impact of government policies on the crypto industry. Known for his thorough research and clear, engaging writing, Emmanuel provides insightful analysis on the latest trends, market shifts, and emerging crypto innovations. His work aims to educate and inform both novice and experienced readers, offering expert perspectives on the fast-evolving world of digital assets. With a passion for staying ahead of the curve, Ogwu is a trusted voice in the cryptocurrency and blockchain space.