


Bitcoin traded at $65,071 at 23:27 UTC on 15 November, up 2.19% over 24 hours, after the Bybit BTCUSDT perpetual contract printed a session low of $61,899.20. From that low to the latest print is a 5.13% move. The rebound did not come with a change in positioning: funding on the two largest perpetual venues stayed negative through it, at -0.001321% per eight hours on Binance and -0.000495% on OKX. US spot bitcoin ETFs had recorded $2.35 billion of net outflows across the ten November sessions through Friday. The tape turned. The plumbing has not.
A $61,899 Low and a 5.13% Rebound
The weekend range is visible in venue data rather than in any single index. Bybit’s linear BTCUSDT contract last traded at $65,072.60 against a 24-hour high of $66,132.70 and a low of $61,899.20, a 6.8% range between the two extremes. Open interest on that contract stood at 69,829.973 BTC, or $4.55 billion at the mark price. Binance’s mark price for the same pair was $65,091 against an index price of $65,117.49, so the contract traded 0.04% below spot at the snapshot, a small discount rather than the premium that usually accompanies leveraged long demand.
CoinGecko’s daily series puts the wider move in context. Bitcoin closed 30 days ago at $81,523.66 and set a local high of $84,082.27 on 22 October. The current price is 20.18% below the first figure and 22.61% below the second, and reclaiming the October high would require a 29.22% advance. The 30-day low in that same daily series is $64,120, printed on 15 November, which is the closing-basis counterpart to the lower wick Bybit recorded intraday. The weekend session also capped a sixth consecutive weekly loss, a slide the Fed’s stability report had already flagged before the selloff accelerated.
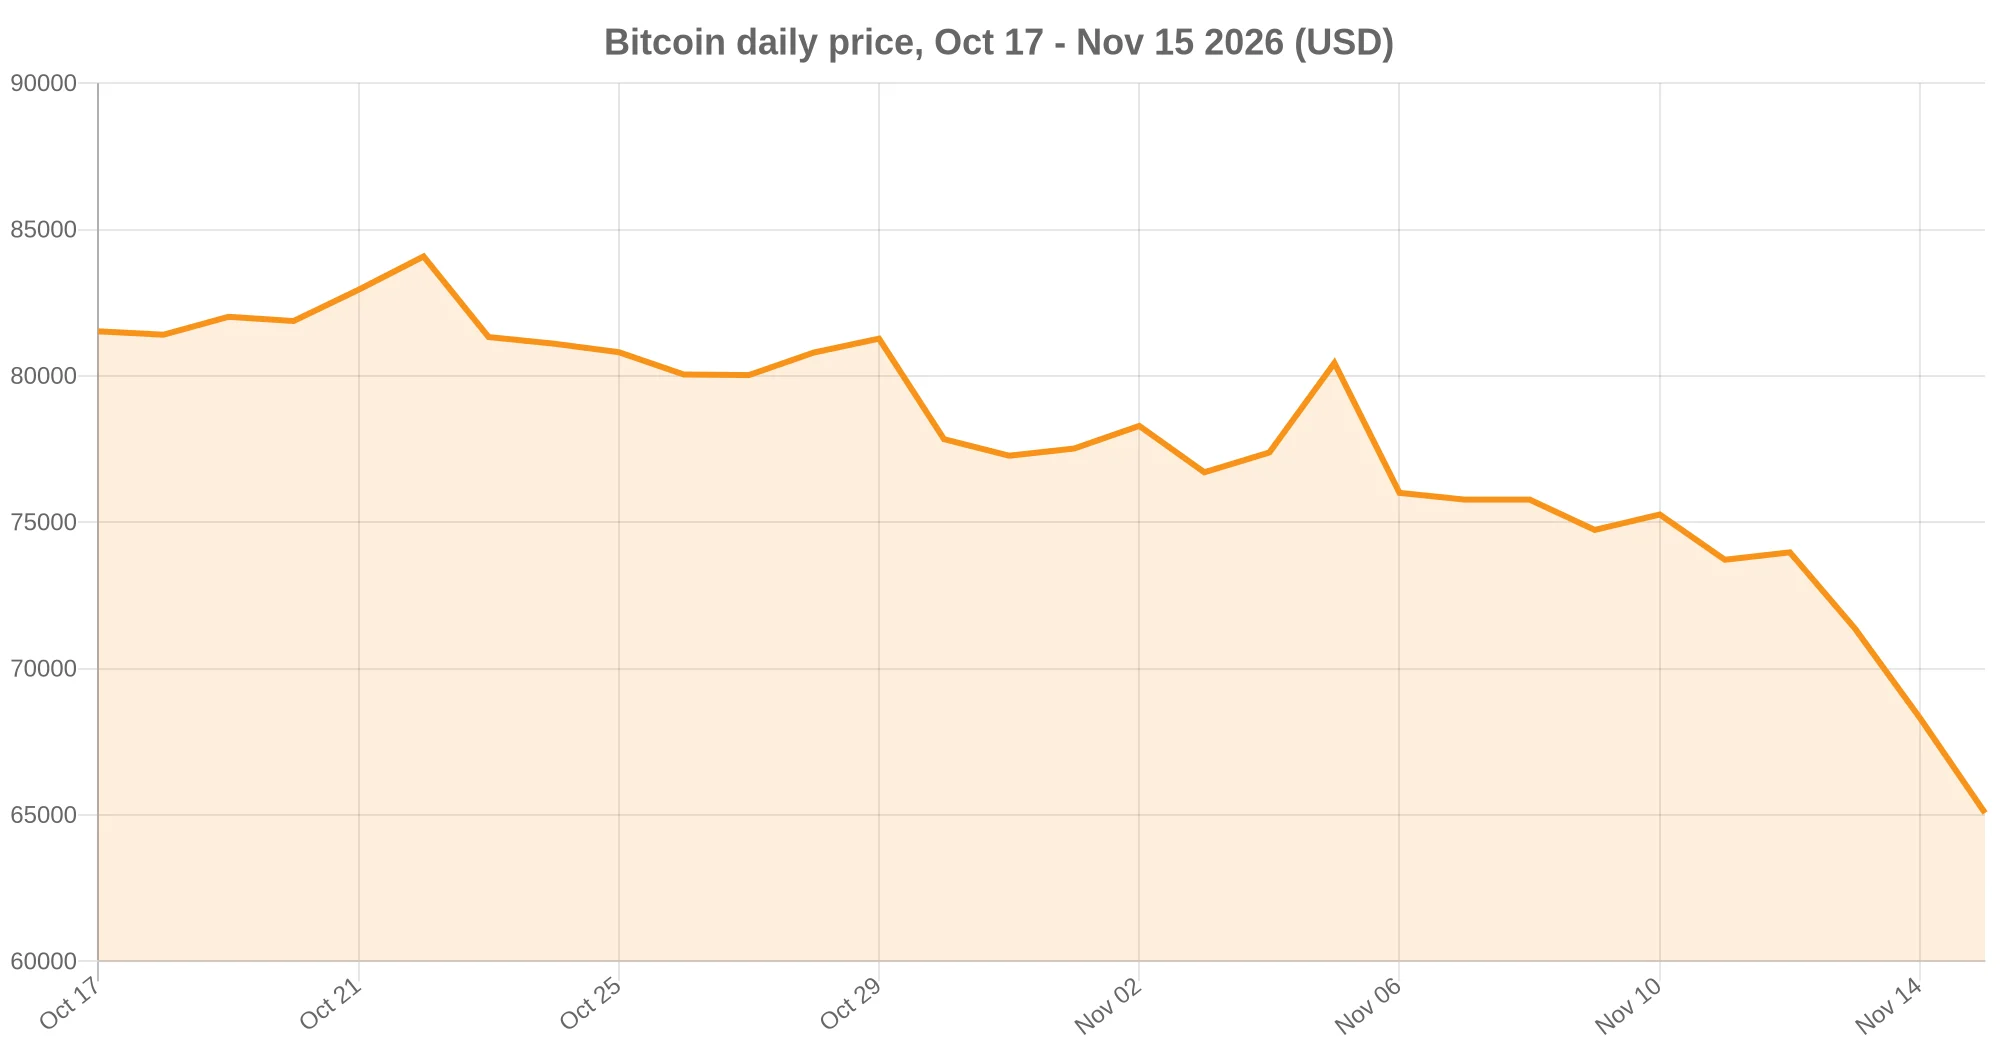
Weekend sessions matter here because the books are thinner. When spot liquidity is reduced, the same nominal sell order moves price further and stops cluster where they are easiest to reach. That mechanism explains why the low arrived on a Sunday rather than during a US session, but it does not explain who was selling, and no venue has published an account of the flow. What can be measured is the residue: a price 5.13% above its own session low, with derivative positioning still tilted to the downside.
Funding Stayed Negative Through the Bounce
Perpetual funding is the recurring payment between longs and shorts that keeps a contract near spot. Binance charges or pays it every eight hours, with a 0.01% interest-rate component per interval. At 23:27 UTC on 15 November, the last settled rate on Binance’s BTCUSDT contract was -0.001321%, meaning shorts paid longs. Annualised at three intervals a day, that is -1.45% a year against the long side. OKX’s BTC-USDT swap carried -0.000495% per eight hours, or -0.54% annualised, with a premium of -0.0645% and the next funding stamp due at 00:00 UTC on 16 November.
Two independent venues quoting the same sign is more informative than either alone. Negative funding after a liquidation cascade is the signature of a market where short exposure was added into weakness and has not been covered yet. It also tells you what the bounce was not: it was not a wave of new leveraged longs paying for exposure. Had that been the case, funding would have flipped positive and the mark would have traded above the index. Neither happened at the snapshot.
The caveat is that funding measures the price of leverage, not the direction of demand. A negative rate can persist for days while spot buyers accumulate, and it can flip within one interval if a large position is closed. Treat it as a positioning reading at a timestamp, not as a forecast.
The Spot Side Has Not Turned
Exchange-traded funds are the most transparent proxy for US spot demand, and their November record is one-directional. Farside Investors’ daily table for the ten US sessions of the month reads: 2 November -$398.6 million, 3 November -$115.6 million, 4 November +$74.6 million, 5 November -$430.2 million, 6 November -$411.9 million, 9 November -$201.0 million, 10 November -$95.0 million, 11 November -$299.8 million, 12 November -$284.1 million, 13 November -$185.4 million. The total is -$2,347.0 million, an average of -$234.7 million per session, with nine negative days out of ten.
The concentration is the part worth calculating. BlackRock’s IBIT accounts for -$2,117.9 million of that total, or 90.2% of the ten-session outflow, while the last five sessions alone removed $1,065.3 million. GBTC shed $100.1 million, ARKB $47.5 million and BITB $9.8 million over the same ten sessions. The single new fund in the table, MSBT, took in $57.7 million, which offsets a little more than a quarter of one average session’s exit. This is the same mechanism covered when IBIT drove 78% of a $2.1 billion exit earlier in the month, now with a narrower base and a larger share.
None of those numbers covers the weekend. ETFs do not trade on Saturday or Sunday, so the rebound from $61,899 has no flow print behind it yet. The first test of whether the bounce reflects real accumulation is Monday’s creation and redemption data, and until that arrives the ETF series describes a seller that was still active as of Friday’s close.
The Stablecoin Float Is at Its Lowest Since September 2025
The other liquidity gauge has been contracting for weeks. DefiLlama puts total stablecoin circulating supply at $287.08 billion on 15 November, down from a peak of $312.85 billion on 17 May, a decline of $25.77 billion or 8.24%. Over the last 30 days the float fell $15.97 billion, or 5.27%, and the current level is the lowest since 19 September 2025. In other words, the dollar-denominated collateral that sits behind most crypto trading has been shrinking for six months, not for six days.
Two issuers explain most of the recent leg. Tether’s USDT holds $175.39 billion, or 61.1% of the float, and lost $8.15 billion in 30 days. Circle’s USDC holds $69.31 billion, or 24.1%, and lost $3.52 billion. Together the pair represents 85.2% of all stablecoins and accounts for $11.67 billion of the $15.97 billion monthly decline, which is 73.1% of it. The rest is spread thin: Sky’s USDS fell $1.71 billion, World Liberty’s USD1 $985 million, Global Dollar $382 million and PayPal’s PYUSD $245 million, while Ripple’s RLUSD added $393 million and Ethena’s USDe $147 million.
The chain split is the more useful cut, because it separates collateral from settlement. Stablecoins issued on Ethereum total $132.74 billion, down $11.74 billion in 30 days, or 8.13%, and down 18.38% over 180 days. Stablecoins on Tron total $93.37 billion, down just $1.16 billion in 30 days, or 1.22%, and up 3.98% over 180 days. Ethereum therefore accounts for 73.5% of the entire monthly contraction while Tron accounts for 7.2%. Ethereum is where stablecoins are used as collateral in lending and derivatives; Tron is where they are mostly moved between parties. A contraction concentrated on the collateral side is consistent with deleveraging inside DeFi rather than with households cashing out, and that reading is an inference from the distribution, not a measured flow.
One caution on interpretation: a falling stablecoin float is not a one-for-one loss of buying power. Supply can contract because holders redeem into bank deposits, and it can also move into instruments this dataset does not count as pegged dollars. The direction over six months is unambiguous; the size of the effect on spot demand is not.
The Bounce Is Bigger Outside Bitcoin
The 24-hour moves across large-cap assets were ordered by beta rather than by quality. XRP rose 8.06% to $0.9718, recovering from a weekend print near $0.89 that made it the weakest major; Ethereum added 4.58% to $1,825.52; Solana 4.27% to $72.24; Monero 6.66% to $494.69. Bitcoin’s 2.19% was the smallest of the group. Measured against Bitcoin, XRP moved 3.68 times as much in percentage terms and Ethereum 2.09 times.
That ordering is the normal shape of a short-covering rally. The assets with the most crowded short interest and the thinnest books bounce hardest, and the largest, deepest market lags. It is not the shape of a rotation into risk: for that, you would expect the strongest balance sheets and the most liquid venue to lead, and you would expect the derivative positioning described above to be paying for long exposure rather than being paid for short exposure.
Ethereum’s relative strength is worth noting for a different reason. It bounced while its own stablecoin base shrank 8.13% in 30 days, which means the move was not financed by new on-chain dollars. That does not make the bounce false. It makes it a repricing of existing positions rather than an inflow event.
Levels That Have a Basis
Three prints from the session do the analytical work, and each has a defined origin, a timeframe and a condition that would invalidate it.
The first is $61,899.20, the Bybit 24-hour low. A close below it on the intraday and daily series would say the weekend flush is unresolved and that the 5.13% bounce was a retracement inside a downtrend rather than a reversal. The second is $66,132.70, the Bybit 24-hour high. A close above it, particularly if funding turns positive at the same time, would indicate that leverage demand has returned to the long side and that the short tilt has been cleared. The third is $84,082.27, the CoinGecko daily high of 22 October, which sits 29.22% above the current price and is the only reference in this window that would mark a recovery rather than a bounce.
No further targets are derived here. Chaining levels from a thin weekend range produces numbers without evidence, and the only figures used above are prices that venues actually printed between 23:27 and 23:30 UTC on 15 November, alongside the CoinGecko daily closes cited earlier.
What the Data Does Not Establish
The ETF outflows and the price decline happened in the same window. That is a coincidence in time, not a demonstrated causal chain: flows are reported after the close, they describe authorised participants’ net creations, and a large redemption can follow a price move rather than cause it. The same restraint applies to the stablecoin contraction, which has run for six months while bitcoin traded through several higher ranges.
Venue-level liquidation totals were not used in this article. CoinGlass, the standard aggregator for that data, requires an API key for its current endpoints, and the figures circulating on social media for the weekend could not be checked against a primary venue feed. Reporting a number that cannot be verified would be worse than leaving it out.
The positioning read is also one snapshot. Funding, open interest and the mark-index spread all reset at the next eight-hour stamp at 00:00 UTC. Monday’s ETF data and the next funding print are the two observations that will decide whether the weekend rebound was the start of a repair or a pause inside a drawdown.
Data: CoinGecko, Farside Investors, DefiLlama, Binance Futures, Bybit, OKX.
Prices, funding rates and open interest are point-in-time snapshots taken between 23:19 and 23:30 UTC on 15 November 2026 and will change. Percentage changes, the off-low move, the IBIT share of November outflows, the annualised funding rates and the chain-level contraction shares are calculated by BlockchainReporter from the sources cited above. This article is not investment advice.
About the author
Blockchain analyst specializing in the regulatory impact of government policies on the crypto industry. Known for his thorough research and clear, engaging writing, Emmanuel provides insightful analysis on the latest trends, market shifts, and emerging crypto innovations. His work aims to educate and inform both novice and experienced readers, offering expert perspectives on the fast-evolving world of digital assets. With a passion for staying ahead of the curve, Ogwu is a trusted voice in the cryptocurrency and blockchain space.