

Kraken’s parent company made less money last quarter than in the same quarter a year earlier, and it kept more than twice as much of what it made. Payward reported $487 million of Total Platform Margin and $60 million of adjusted EBITDA for the three months to Sept. 30, 2026, with the EBITDA margin rising to 12% of margin from 5% in the second quarter, according to the company’s Q3 2026 financial highlights published on Nov. 13.
The headline number answers the obvious question first: Payward’s margin fell 12% year over year, from a level the release’s own percentage implies was about $553 million in the third quarter of 2025, while trading volume fell 30% to $353 billion. The profit line moved the other way. Adjusted EBITDA was $23 million in the second quarter and $60 million in the third, a 161% sequential increase that arrived in a quarter when the industry’s spot volume shrank.
That split is the story of the quarter. Payward is not earning more because clients traded more than a year ago. It is earning a larger share of a smaller pie, and it is earning it from places other than the trade button.
What Payward reported for July to September 2026
The company also changed how it reports. Total Platform Margin replaces Adjusted Revenue, and the difference matters: the old measure deducted the cost of crypto delivered to clients in a trade but not the staking rewards paid to them, while TPM deducts both. That makes the new top line structurally smaller than the old one, and it means this quarter’s figure cannot be lined up against Adjusted Revenue prints from earlier periods without that adjustment in mind.
| Metric | Q3 2026 | Q2 2026 | Q3 2025 |
|---|---|---|---|
| Total Platform Margin | $487M | $436M | ~$553M (implied) |
| Transaction-based TPM | $234M | ~$219M (implied) | not disclosed |
| Asset-based TPM | $128M | ~$102M (implied) | not disclosed |
| Access-based TPM | $125M | ~$117M (implied) | ~$79M (implied) |
| Adjusted EBITDA | $60M | $23M | not disclosed |
| Adjusted EBITDA margin | 12% of TPM | 5% of TPM | not disclosed |
| Total Platform Transaction Volume | $353B | ~$289B (implied) | ~$504B (implied) |
| Contracts traded | 66M | ~60M (implied) | ~36M (implied) |
| Assets on Platform (average) | $43B | ~$41B (implied) | ~$54B (implied) |
| Funded accounts | 7.1M | ~6.6M (implied) | ~5.2M (implied) |
| Billable accounts | 1.5M | ~1.38M (implied) | ~0.86M (implied) |
Figures marked implied are this article’s arithmetic from the growth rates Payward disclosed, not numbers the company printed. Where the release gives a year-on-year comparison for adjusted EBITDA, it does not do so at all: the only EBITDA comparison in the document is the sequential one.
The mix moved, and the cost base barely did
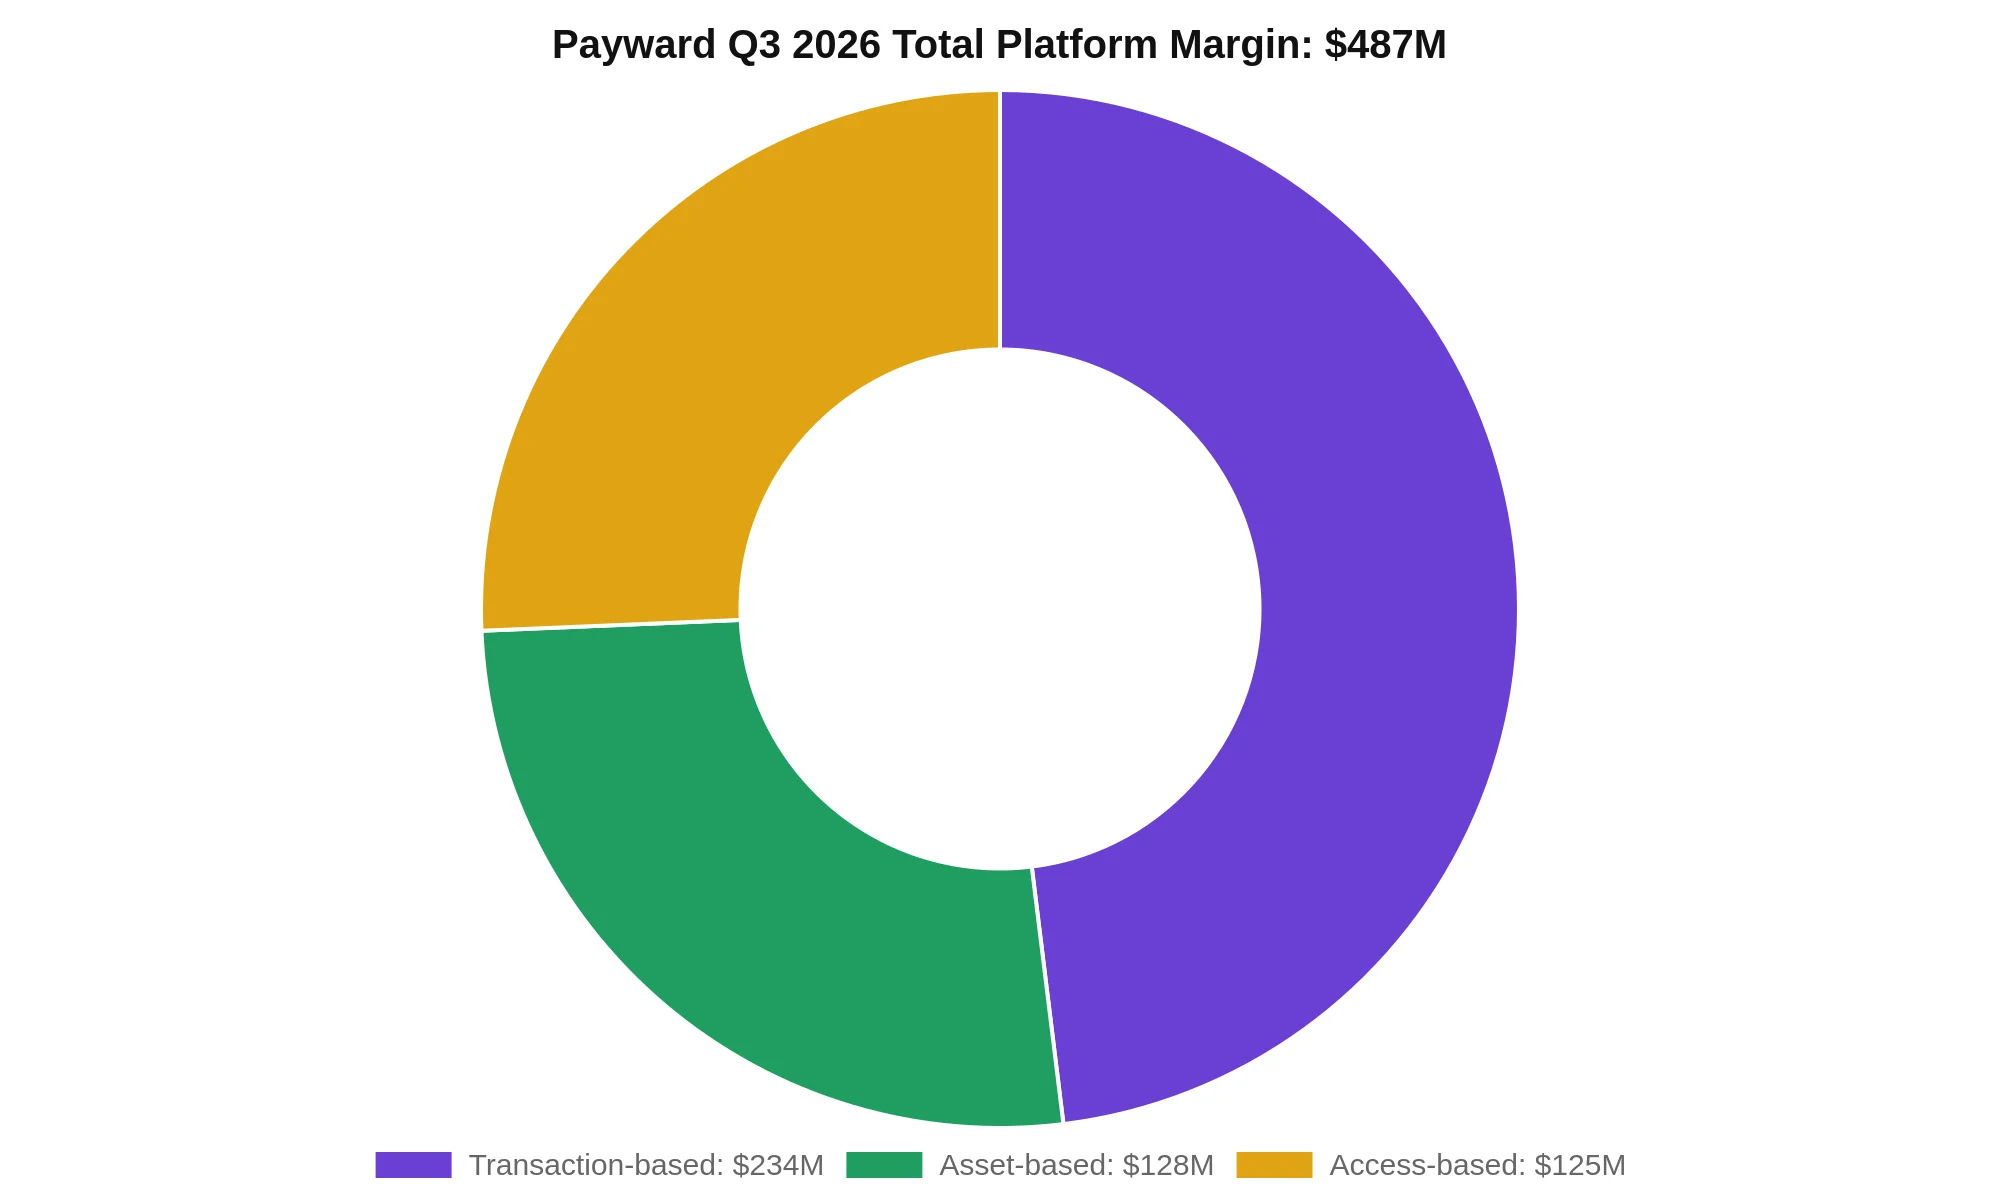
Transaction-based margin rose 7% to $234 million. Asset-based margin, what Payward earns over time on balances clients leave with it, rose 26% to $128 million. Access-based margin, which covers trader evaluations, subscriptions, listings and index licences, rose 7% to $125 million but is up 59% from a year earlier.
Those two slower-moving categories now carry the quarter. Payward put it this way in the release: “Asset- and access-based TPM together made up 52% of the total, up from 50% in Q2 2026 and 46% in Q3 2025.” Six points of mix shift in twelve months is the mechanical reason a 12% decline in margin produced a margin rate that doubled.
The expense side explains the rest. Subtract adjusted EBITDA from TPM and the implied cost base was about $427 million in the third quarter against about $413 million in the second, a rise of roughly 3.4% while margin grew 12%. Nothing in the release breaks that cost base apart, so the split between lower compensation, lower marketing and lower pass-through costs is not visible from the outside. What is visible is that the company added $51 million of quarterly margin and about $14 million of cost.
The client base kept growing through it. Funded accounts reached 7.1 million, up 7% from the second quarter and 37% from a year earlier, and Payward noted that “accounts with balances have grown about 35% per year since the end of 2023.” Billable accounts, the ones that pay for access rather than for trades, reached 1.5 million, up 74% year over year. Access-based margin works out to roughly $83 per billable account per quarter.
Volume rose 22% from Q2 and fell 30% from a year earlier
Both statements are true and they describe different things. Total Platform Transaction Volume was $353 billion, up 22% sequentially and down 30% year over year, in a quarter when industry spot volume fell 7% from the second quarter. Payward’s share of industry spot volume was 6.5% in September 2026 against 3.3% in September 2025, which is the closest thing in the document to a competitive claim the company can support with a number.
The mix inside that volume also changed shape. Contracts traded reached 66 million, up 84% from a year earlier, because derivatives are billed per contract rather than on notional value. A venue that earns on contract count is less exposed to the price of the underlying asset than one that earns a flat basis-point fee on spot turnover.
The fee arithmetic shows how far that has gone. Dividing TPM by transaction volume gives about 13.8 basis points in the third quarter, against about 15.1 basis points in the second quarter and about 11.0 basis points in the third quarter of 2025. The sequential decline is what a derivatives-heavy, lower-notional book looks like; the year-on-year increase is what a richer asset and access mix looks like. The release does not present this ratio, and neither interpretation is confirmed by the company.
The quarter that ignores November
These results stop at Sept. 30. Bitcoin traded at $68,845 on Nov. 13, down 3.6% in 24 hours and 8.8% over seven days, while ether sat near $1,945 after a 12% weekly decline. None of that appears in the third-quarter numbers, and it is the main reason the fourth quarter will not look like the third.
Asset-based margin is the exposed line. Payward averaged $43 billion of Assets on Platform in the quarter, down 21% from a year earlier in dollar terms, and it reported that the same balances measured at constant prices rose 29% to $71 billion. The gap between those two figures is the price effect: clients kept adding assets, and the dollar value of what they held still fell. In a quarter when crypto prices fall further, that line compresses regardless of how many accounts sign up.
The release is candid about the mechanic without naming the risk: 52% of margin now depends on balances and access fees rather than on trading activity, and roughly a quarter of the total depends on clients continuing to pay for products that are priced in dollars but sold to people whose portfolios are priced in bitcoin.
What the release does not say
Payward is privately held and publishes highlights rather than full financial statements. There is no net income figure, no operating cash flow, no balance sheet and no statement of how much of the $60 million of adjusted EBITDA would survive the adjustments that EBITDA excludes. The company also makes no reference to an IPO timetable, a prospectus or an SEC filing in the document.
Two forward-looking items need the same care. The Saldo Bank acquisition, which would give Payward an EU banking licence, was agreed in October and remains subject to regulatory approval, as BlockchainReporter reported at the time. The plan to move US dollar wires onto the company’s own Federal Reserve master account is described as a next step, not a live capability.
The prior quarter is the useful comparison point for the trend rather than the level: in Q2, Payward grew revenue while profit collapsed, and the third quarter reversed the second half of that sentence without reversing the first. Whether that is a durable operating improvement or one quarter of cost discipline against a shrinking revenue base cannot be settled from a highlights document.
What to watch in the fourth quarter
Three measurable things sit between this print and the next one. The first is prediction markets for US clients, which Payward lists as the next Trading product; it would add a fee stream that does not depend on crypto prices. The second is the share of margin from asset-based fees, which will fall with balances if prices keep sliding and which the company cannot offset with cost cuts indefinitely. The third is the xStocks book, which passed $1 billion in assets under management in October across more than 700 tokenized equities and now feeds both the asset-based and access-based lines.
Payward also completed its quarterly Proof of Reserves as of Sept. 30, validated by The Network Firm, a disclosure that matters more to clients than to the income statement. The regulatory footprint expanded alongside it: full market approval from Dubai’s VARA for a UAE launch and in-principle approval from Kazakhstan’s AFSA.
The quarter is best read as evidence that an exchange can shrink its revenue and improve its economics at the same time, for a while. The 12% margin came from a mix shift and a cost base that grew at a third of the rate of margin. The next two quarters will show whether that holds when the asset prices underneath 52% of the business are falling.
Frequently Asked Questions
How much did Kraken’s parent company make in Q3 2026?
Payward reported $487 million of Total Platform Margin and $60 million of adjusted EBITDA for the third quarter of 2026, a 12% adjusted EBITDA margin. The company does not publish net income in its quarterly highlights.
Is Payward, the parent of Kraken, a public company?
No. Payward is privately held and releases quarterly financial highlights and a quarterly Proof of Reserves instead of SEC filings. The Q3 2026 release does not state an IPO date or refer to a registration filing.
Why did Kraken’s trading volume fall 30% year over year?
Total Platform Transaction Volume was $353 billion, down 30% from the third quarter of 2025 but up 22% from the second quarter of 2026. Payward reported that industry spot volume fell 7% sequentially while its own share of industry spot volume rose to 6.5% in September 2026 from 3.3% a year earlier, so the annual decline reflects a smaller market rather than lost share.
What is Total Platform Margin?
It is Payward’s replacement for Adjusted Revenue, introduced this quarter. It deducts both the cost of crypto delivered to clients in a trade and the staking rewards paid to clients, so every amount passed back to clients is treated the same way. Payward splits it into transaction-based, asset-based and access-based margin.
Does the Q3 result mean Kraken is more profitable than a year ago?
Not on the figures disclosed. Total Platform Margin fell 12% year over year and Payward did not publish a year-on-year adjusted EBITDA comparison, so the annual direction of profit is not established by this release. What the release does show is a sharp sequential improvement, from $23 million of adjusted EBITDA in Q2 2026 to $60 million in Q3.
About the author
Samuel is a professional cryptocurrency writer specializing in blockchain technology and market analysis. He delivers in-depth insights into emerging trends and developments, producing well-researched, engaging content that makes complex crypto topics accessible to both newcomers and experienced industry professionals. Through his analytical approach and clear writing style, Samuel provides valuable perspectives on the evolving digital asset landscape, establishing himself as a credible and trusted voice in the cryptocurrency industry.