- TD Sequential signals FLOKI trend exhaustion, hinting at possible short-term rebound.
- Derivatives data shows rising open interest despite falling volume, suggesting cautious optimism.
- RSI and MACD on daily chart reflect weak momentum but indicate early signs of stabilization.
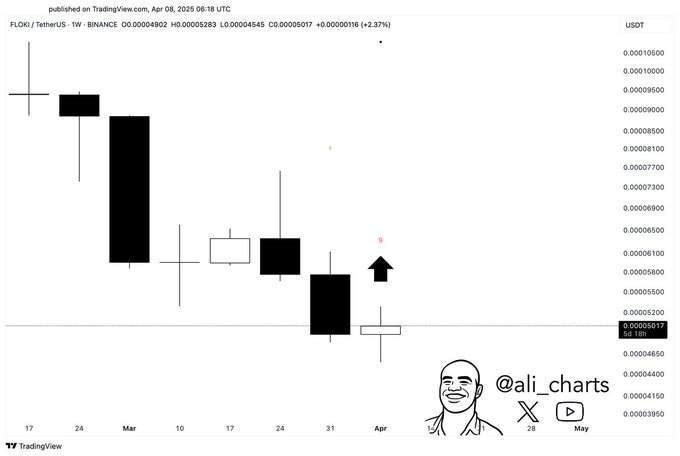
Ali, a crypto analyst, recently shared on his X account that FLOKI may be gearing up for a short-term rebound. His analysis pointed to a fresh buy signal triggered by the TD Sequential indicator on the weekly chart, suggesting that selling pressure may be fading.
The chart also displayed a bullish arrow and a “9” countdown marker, signals typically associated with trend exhaustion. Ali noted that this development could build bullish momentum if support holds and follow-through buying occurs.
Nevertheless, FLOKI’s weekly chart reveals the initial signs that it may experience a reversal of the downtrend after some consecutive weekly losses. The FLOKI/USDT weekly close on Binance was at $0.00005017, up by 2.37% in terms of weekly price. This upturn occurred after many candles showed bearish signals in the middle of March, indicating heavy selling pressures.

The recent white-bodied candle, appearing after a sharp price drop, reflects early buying interest. The TD Sequential’s “9” marker under the latest candle and the presence of a bullish arrow point to a possible reversal. FLOKI is now in the process of experimenting with a critical level of around $0.00004500. If this level stays intact, the token may rebound back to the $0.00006000 region in the short term.
Market Positioning Shows Cautious Optimism
The data signifies positive signs regarding FLOKI’s performance expectations. This declined the trading volume by 29.47% while $29.40 million was transacted. However, open interest increased 6.87% to $13.99 million, which indicated that traders both churned over their positions and entered new positions during the period.
The long/short ratio stands at 1.0321, reflecting a slight majority of long positions. OKX data reveals a stronger bullish trend with a ratio of 2.1. Similarly, Binance top trader metrics indicate long positions dominating account count and size.

Liquidation data over the last 24 hours totaled $27.81K, with long liquidations at $15.03K and shorts at $12.78K. The near-even distribution suggests moderate leverage clearing but no large-scale unwinding of positions, aligning with a market preparing for potential upward movement.
Daily Technicals Indicate Weak Momentum, Possible Stabilization
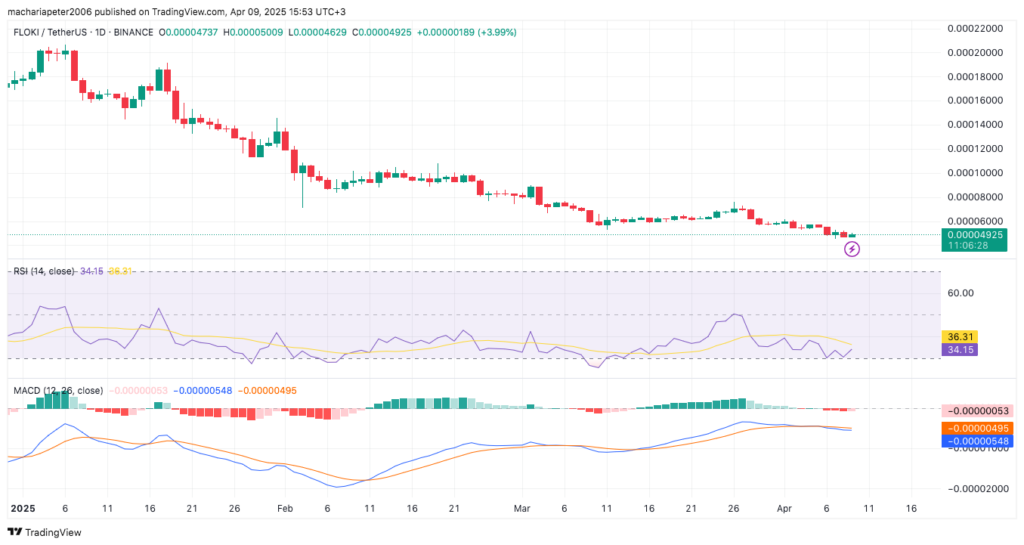
At the same time, every overall indicator in the daily timeframe suggests a bearish bias, but the outlook might change soon. As of April 9, FLOKI’s RSI is at 34.15, approaching oversold territory. This reading shows that downward pressure may be easing, and buyers could step in near current levels.

Furthermore, the MACD line is placed at -0.00000548 while the signal line is slightly above -0.00000495. However, the indicator is still in the negative territory whose histogram is becoming less wide, indicating reducing bearish pressure.


