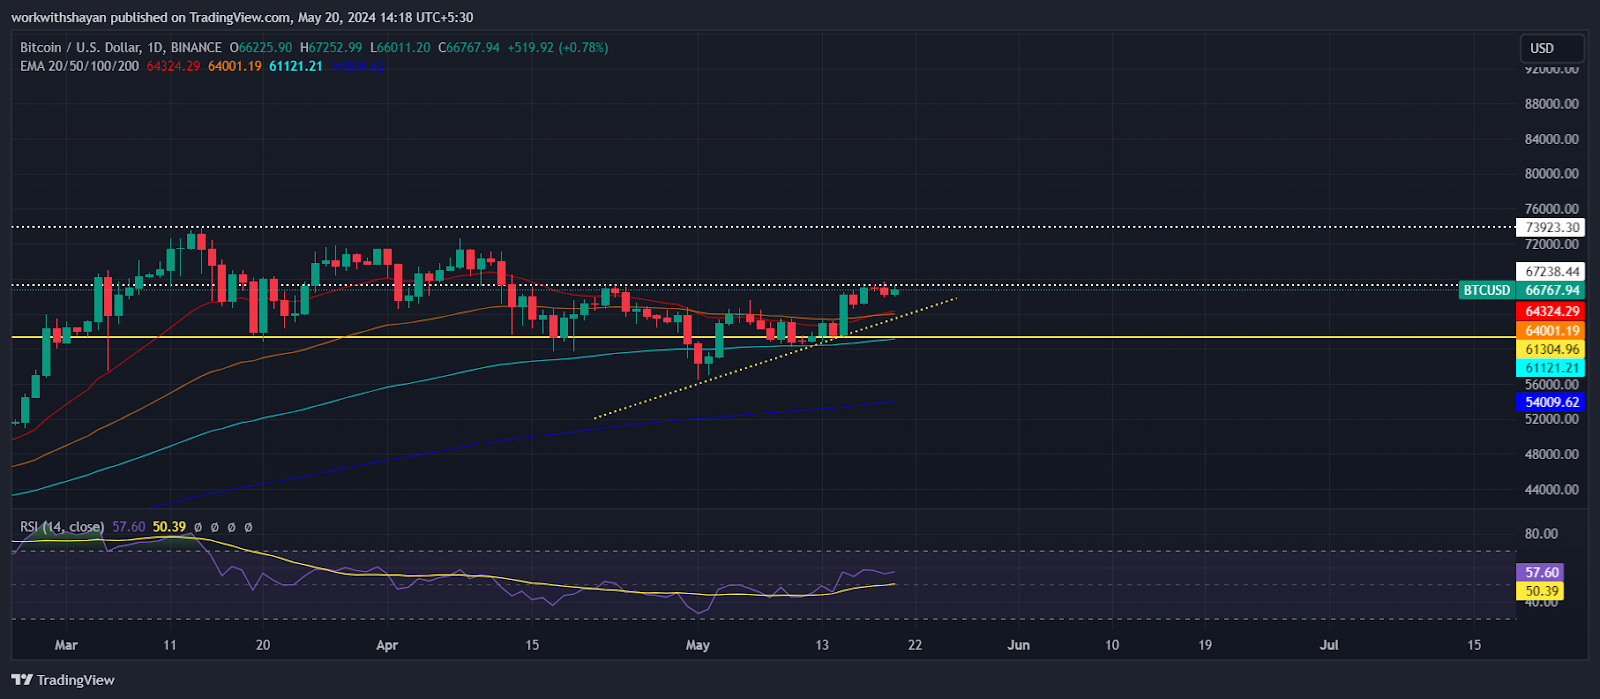
Bitcoin price has been on a buying demand above $67K following softer CPI data last week. Analysts are divided in their opinion about Bitcoin’s next directional move. Some believe that the correction is over and Bitcoin will break out to a new all-time high, while others expect *BTC* to turn down to retest the $60,000 support and go lower. According to on-chain data, the focus has shifted to the Short-Term Holder (STH) realized price, which is suggesting a new potential support level at $61.5K. This comes at a time when Bitcoin’s current trading price stands at approximately $67K, narrowing down from a larger gap observed earlier in the year.
Bitcoin’s Dominance Is At The Top
According to a recent tweet by Mercer, Bitcoin’s dominance is nearing what could be a local peak, as it approaches a descending trend line that has consistently acted as a strong resistance since 2017.
Typically, a rise in Bitcoin dominance indicates a potential shift in market trends as investors might start moving their funds to altcoins in search of higher returns.

As of now, Bitcoin dominance is recorded at 55.8%, showing a slight decrease of 0.12%. Addressing the challenges ahead, noted trader Daan Crypto Trades pointed out that the $72,000 mark currently stands as the most significant resistance zone.
Previously, the price managed to surpass a substantial resistance cluster around $67.4K, yet it still faces strong levels around approximately $68K. Beyond this, the most substantial liquidity is found at and beyond the $72K mark. Adding to the bullish outlook, well-known trader and analyst Rekt Capital suggested that Bitcoin is only a mere 1% price increase away from initiating a new phase in the bull market.
“BTC only needs to decrease by an additional -1% to attempt a post Bull Flag breakout retest, aiming to establish trend continuation upwards,” he stated, while analyzing the daily charts.

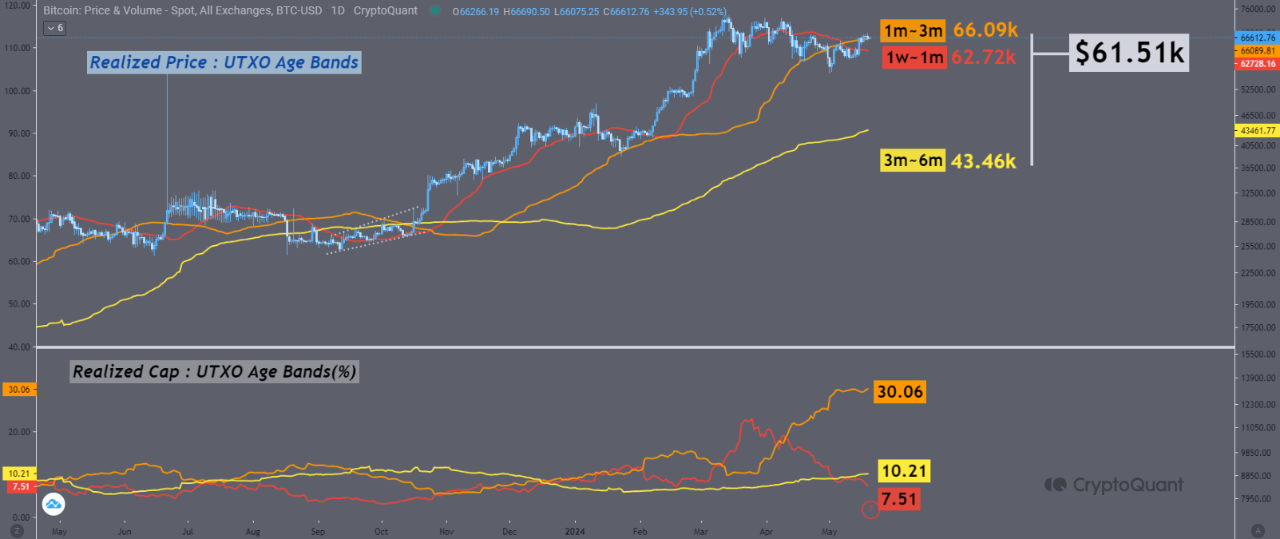
According to CryptoQuant’s STH realized chart, $61.5K is the new support floor for BTC price. The realized price for Bitcoin, particularly among short-term holders — those who have held their coins from a day to six months — is a critical metric for gauging market bottom or potential reversal zones. This price metric represents the average cost at which the current set of Bitcoin was last moved, adjusted by the age of each coin in the cohort. As of now, this cohort accounts for 53.48% of Bitcoin’s total market cap.
For a more granular understanding, the STH cohort can be broken down further:
- The 0 day to 1 week group, covering 10.6% of the market, closely tracks the spot price and thus often doesn’t show significant variance.
- The 1 week to 6 months group, on the other hand, represents 47.78% and is more reflective of short-term trader behavior and sentiment.
Will Bitcoin’s Support Turn Into Resistance?
In the early parts of April, the gap between the STH realized price and the actual market price of Bitcoin was as high as $9K. However, this gap has since tightened to about $5.09K, indicating a consolidation phase that could potentially solidify $61.5K as a strong support level.
This tightening is seen alongside a notable change in market share from long-term holders (LTH) to STH, highlighting a transfer of volume that can be attributed to the increased activities of newer market participants. Notably, the share of the market from 1 month to 3 months cohort surged from 10% to over 30% within just two months, during which Bitcoin experienced a significant rally in March.

Short-term holders (STH) of Bitcoin tend to react more quickly to price changes than long-term holders (LTH). This sensitivity makes the $61.5K price level very important, as it can serve as both a support and a potential resistance point. If this price level remains stable, it could boost investor confidence and support a positive short-term outlook for Bitcoin.
However, the stability of the $61.5K level is not certain. If it fails to hold, it could indicate a loss of investor confidence and might even become a strong resistance level. This is often called an S/R flip (support/resistance flip), where a previous support level becomes a resistance level after being broken.


