Leading memecoins such as Pepe Coin (PEPE), *SHIB*, and *DOGE* have experienced a notable drop in their market value, following closely on the heels of *BTC* retreat from its recent peak at $70,000. Consequently, the memecoin sector is currently on a downward trajectory, with these prominent meme-based cryptocurrencies gearing up for a potential retest of their initial surge points amidst a surge of bearish on-chain metrics.
Whale Interest Continues To Drop For Memecoins
The market for meme coins, highlighted by popular tokens such as Dogecoin, Pepe coin and Shiba Inu, is undergoing a period of instability. A downturn in critical on-chain metrics points to an increasing bearish momentum, signifying a surge in selling activity among these famed meme coins.

Data from IntoTheBlock shows a significant reduction in large-scale transactions for Pepe coin, plummeting by over 55% from $374 million worth of PEPE to a mere $143 million worth of PEPE. This sharp decline suggests a declining interest from large-scale investors or “whales.” Such a downturn could exacerbate market fluctuations and plunge the likelihood of a positive trend reversal in the near future.
On the other hand, Shiba Inu’s whale transactions in USD dropped from the peak of $2.05 billion to only $363 million, suggesting a drop in volatility and whale interest. This might consolidate the SHIB price within a bearish zone for an extended period.
Interestingly, DOGE price has not witnessed much bearish activity on-chain as whale interest has been stable in recent weeks. Notably, Dogecoin doubled its large transactions as it surged from the low of $2 billion to over $5 billion.
Dogecoin Price Analysis
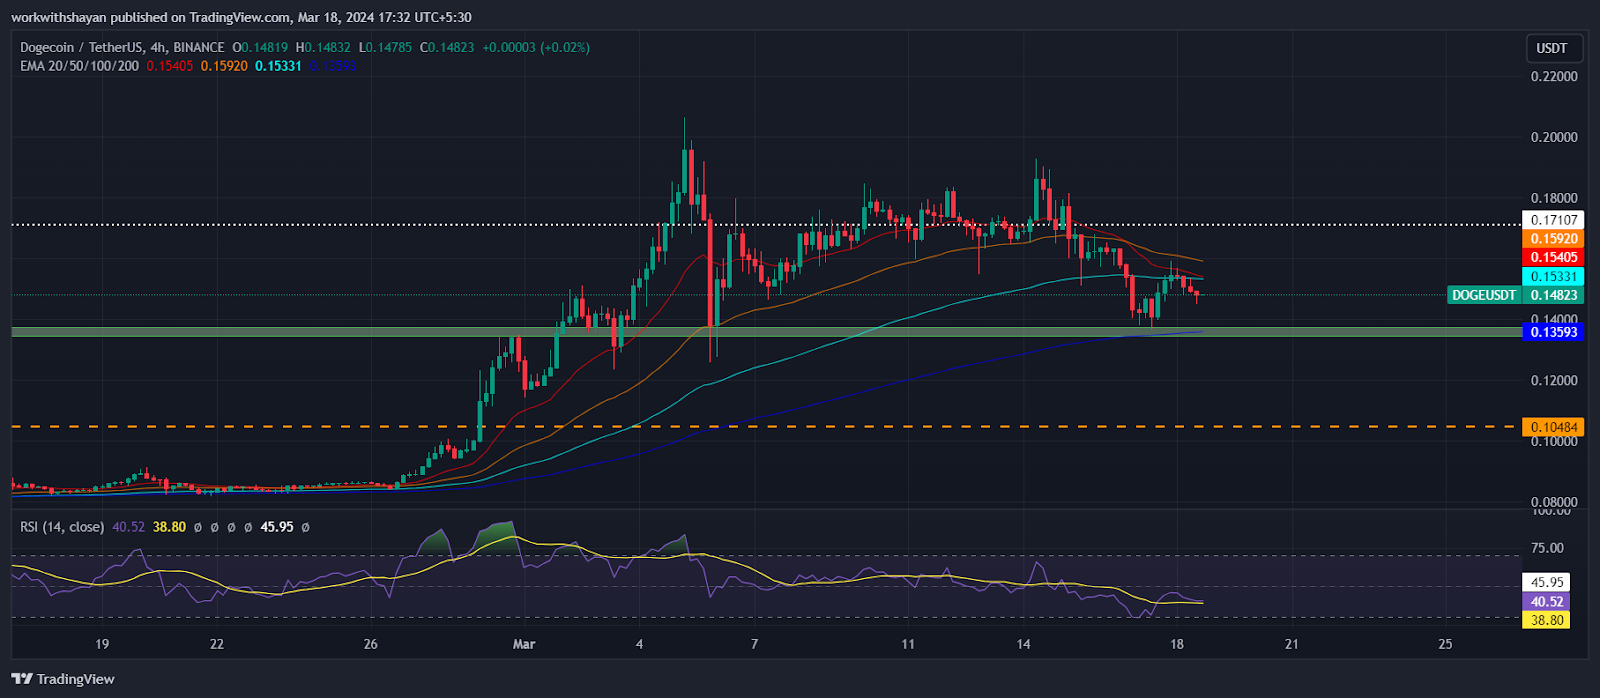
Efforts by sellers to push Dogecoin into a downward trend were met with robust buying resistance, leading to a rebound in DOGE price from key Fibonacci levels. Currently, Dogecoin’s value is at $0.147, experiencing a decrease of more than 0.7% from yesterday’s price.

The 20-day Exponential Moving Average (EMA) has fallen to $0.154, signaling a bearish direction. Additionally, the Relative Strength Index (RSI) has dropped from the midline and currently trades at level 40, indicating a shift towards selling dominance.
If Dogecoin remains below these averages, it could face challenges in building any upward momentum. This situation reflects a growing bearish outlook, with the likelihood of increased selling pressure at even minor price increases. A drop below the support level of $0.1 might trigger further sell-offs. However, a surge above $0.17 will bring buying demand
Pepe Coin (PEPE) Price Analysis
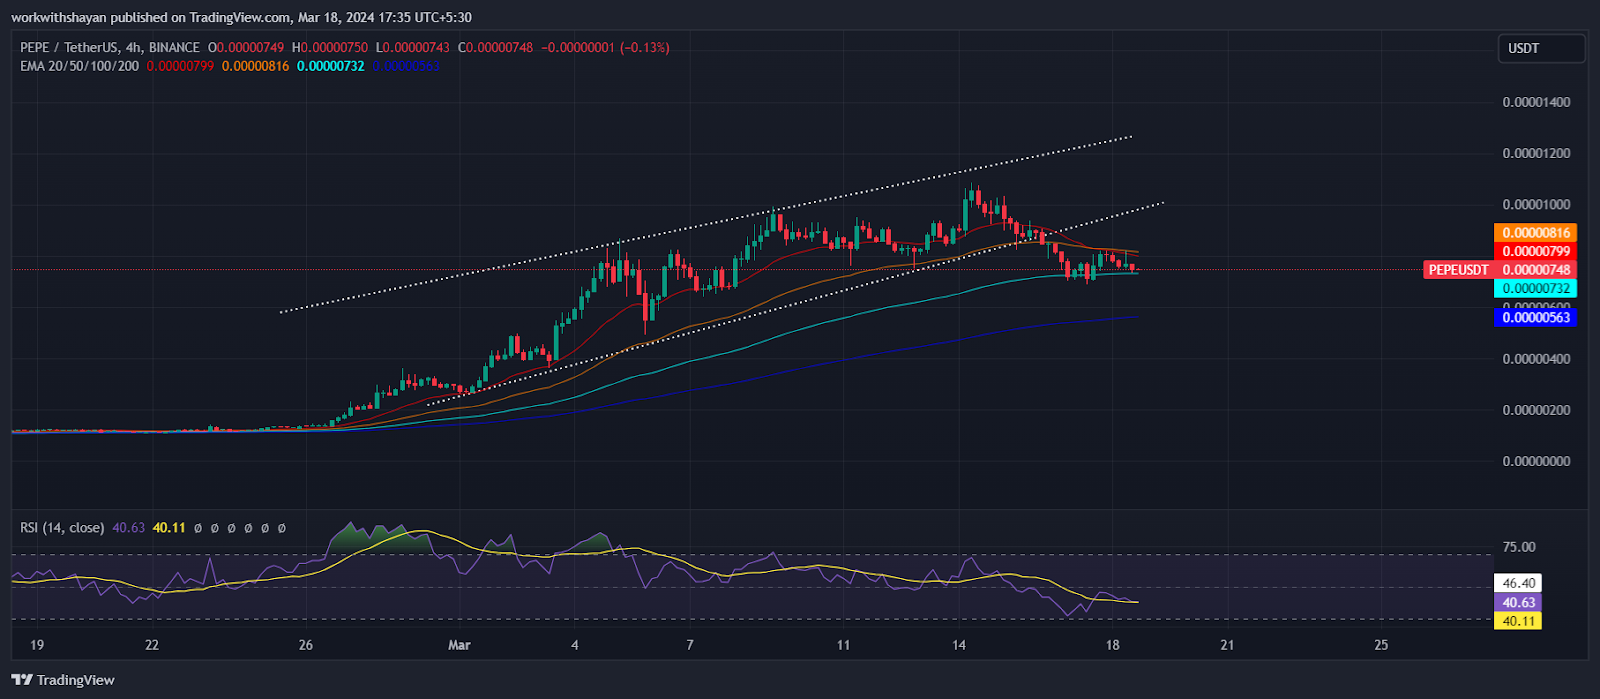
Bulls are actively buying at lower levels, ensuring that Pepe’s value remains above its 100-day Exponential Moving Average (EMA) of $0.000007, indicating strong demand at these prices. The 100-day EMA is stabilizing, while the Relative Strength Index (RSI) is dropping below the midline as it trades at 40, suggesting a potential pullback soon. Currently, Pepe’s price is undergoing a correction, retreating from a peak of $0.000011. At the moment, Pepe’s price is trading at $0.00000747, marking a decrease of 2.5% from the previous day.

For bulls to dominate, they must push the price beyond $0.000011, potentially kick-starting a climb towards $0.00002. Nonetheless, bears are putting up resistance to this bullish momentum, as evidenced by the current price downturn.
Should the price fall beneath the EMA100, it would confirm the bears’ upper hand, likely leading to increased selling. Under these conditions, the Pepe price could be put to the test, with support levels at $0.0000053 to $0.000001 challenging the patience of buyers.
Shiba Inu (SHIB) Price Analysis
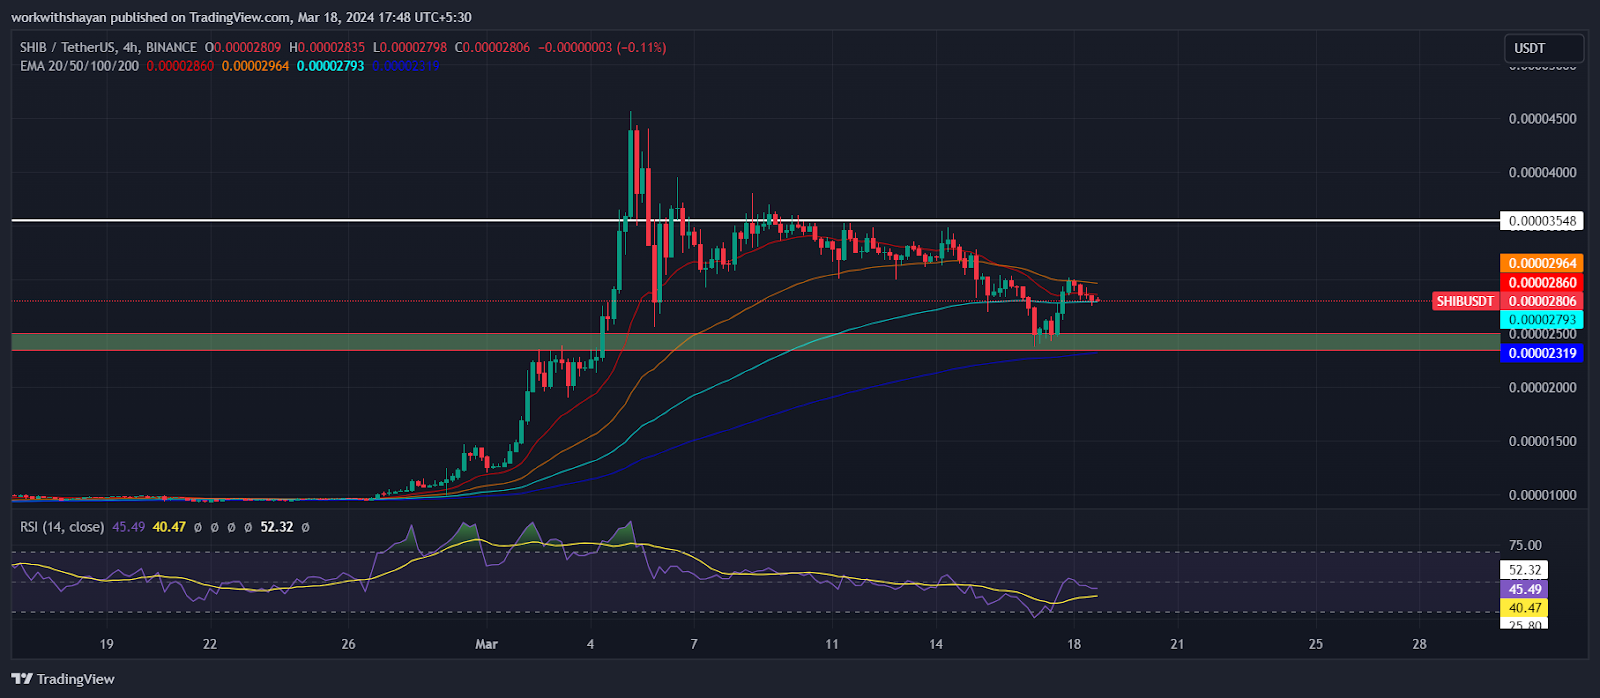
Shiba Inu has experienced a setback following its inability to maintain upward movement around $0.000035, indicating that short-term investors might be taking profits. Such downturns can sometimes shake investor confidence, possibly resulting in a consolidation phase for SHIB’s price, marked by a downward trend. At present, SHIB is valued at $0.00002804, reflecting a decrease of over 4.88% compared to the price on the previous day.

The negative direction of the 20-day EMA, currently at $0.0000286, along with an RSI approaching the 45 mark, suggests that the market is leaning towards bearish sentiment. A fall below $0.000023 could direct the price towards a critical support level at $0.000014, which might attract buyers back into the market. However, continued sell-offs could push the price down to $0.00001.
On the flip side, a surge above the EMA trend lines could indicate a resurgence of buying interest, potentially reigniting the upward trend with a goal of reaching $0.000045.


