Solana (SOL) has experienced a notable upswing, currently trading at $173.05 after a 2.46% increase over the past 24 hours. Increased network activity, along with significant dApp usage and on-chain developments, has contributed to this bullish sentiment. Recent trading data indicates that the upward momentum may be supported by high liquidity on major exchanges, reinforcing the technical strength behind SOL’s performance.
Solana Price Analysis

The RSI for Solana is currently hovering around neutral levels. This balance suggests that SOL is neither significantly overbought nor oversold, leaving room for the momentum to build in either direction. If positive news or increased buying pressure continues, the RSI may move into overbought territory, which could eventually trigger a corrective pullback. Conversely, if sellers gain control, the RSI could fall into oversold territory, potentially setting the stage for a rebound.
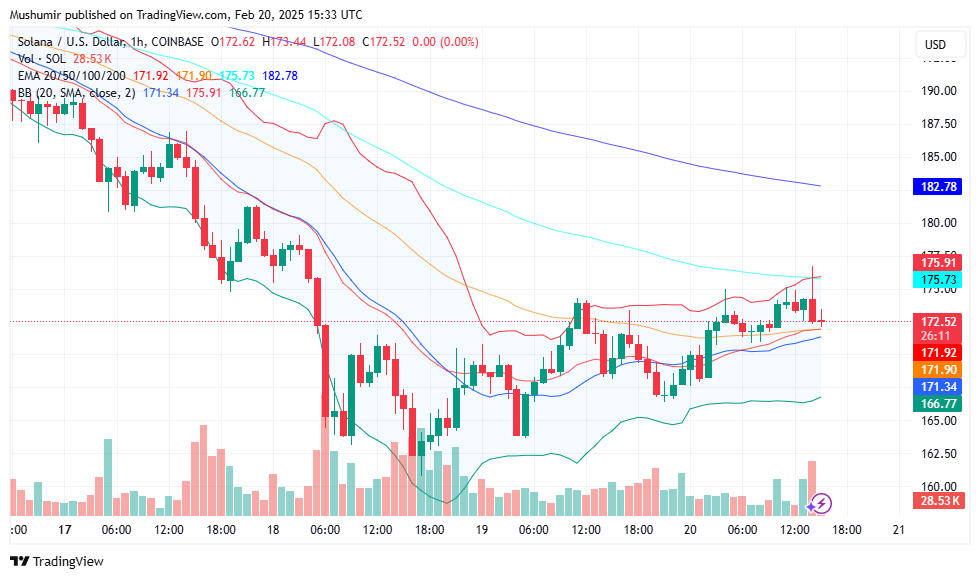
Short-term moving averages, such as the 20-day and 50-day lines, are trending upward along with the recent price increase. These averages are acting as dynamic support levels, confirming that SOL is currently experiencing bullish momentum. The 200-day moving average, an essential long-term support indicator, remains well-respected. Sustaining a position above this level is a critical sign that the overall upward trend is intact. However, a breakdown below these averages could signal a shift in sentiment and the onset of a corrective phase.
The MACD indicator is currently showing early signs of bullish divergence. With the MACD line beginning to pull above its signal line, there is an indication that the underlying momentum may continue to build. A confirmed bullish crossover would reinforce the potential for further gains, while a bearish crossover could indicate that the upward trend is losing steam.
Technical analysis reveals that SOL’s price has found key support near the $165–$170 zone, which historically has acted as a safety net during periods of market retracement. On the upside, resistance is forming in the $175–$180 range. A breakthrough above this resistance could pave the way for a sustained rally, potentially pushing SOL into higher price territory. Conversely, failure to hold the support level may lead to further declines, especially if broader market conditions deteriorate.
Beyond traditional technical indicators, on-chain metrics provide additional insights into Solana’s current state. Recent data shows an increase in active wallet addresses and transaction volumes on the Solana network, signaling robust usage and healthy network growth. Positive community sentiment on social media and among developers, spurred by announcements of upcoming protocol upgrades and new dApp launches, further supports the bullish outlook. These combined factors suggest that SOL is well-positioned to benefit from both organic growth and external market catalysts.
Solana Price Prediction
We can outline several potential scenarios for SOL’s price on February 20, 2025.
Bullish Scenario
If current buying interest continues and key support levels hold:
- Breakout Potential:
Should SOL maintain its support in the $165–$170 range and successfully break through the resistance zone at $175–$180, a bullish breakout may ensue. In this scenario, positive catalysts such as enhanced network upgrades, further dApp adoption, or favorable market sentiment could drive the price toward the $180–$190 range in the near term. - Catalyst-Driven Rally:
External factors, including positive regulatory news or institutional investment in Solana’s ecosystem, could further fuel the rally. This may lead to accelerated buying pressure and push SOL toward the upper end of our forecast range, potentially even exceeding $190 if the momentum remains strong.
Bearish Scenario
If bearish pressure or negative catalysts come into play:
- Retracement Risk:
A failure to hold the crucial support level at $165–$170 could lead to a short-term correction, with SOL potentially retracing toward the $160 level or slightly lower. This scenario might be triggered by profit-taking or negative market news that temporarily shifts investor sentiment. - Consolidation Phase:
In the absence of strong bullish catalysts, SOL could remain in a consolidation phase, trading within a narrow range between $165 and $180 until a definitive market signal emerges. This scenario would be characterized by sideways trading and low volatility as market participants wait for clear directional cues.
Consolidated Forecast Range
Taking into account both the bullish and bearish scenarios, our consolidated short-term Solana price prediction on February 20, 2025, is that SOL will likely trade within a range of $160 to $190. This range reflects the current balance between positive technical signals—such as an upward trending MACD and supportive moving averages—and the potential risk of a corrective pullback if key support levels are breached.
Frequently Asked Questions (FAQs)
What is the price prediction for Solana on February 20, 2025?
Our analysis suggests that Solana is expected to trade within a range of $160 to $190 on February 20, 2025, based on current technical indicators and market sentiment.
What are the short-term price predictions for Solana?
In the short term, if SOL maintains support around $165–$170 and breaks through resistance near $175–$180, it could rally toward $180–$190. Conversely, increased selling pressure might drive the price toward $160.
How has Solana performed recently?
Recently, Solana has shown a strong performance, currently trading at $173.05 after a 2.46% increase over the past 24 hours. This uptick indicates renewed buying interest and robust trading activity.
Investment Risk Consideration
Investing in Solana, as with all cryptocurrencies, involves a degree of risk that investors should carefully consider. Investors should ensure they only invest funds they can afford to lose and should diversify their portfolios to mitigate risks. Comprehensive research and robust risk management practices are essential when navigating the unpredictable nature of the cryptocurrency market.


