- 1. The Graph Network: A Quick Overview
- 2. GRT: A Silent Killer
- 3. The Graph Price Prediction: Price History
- 4. The Graph Price Prediction: Technical Analysis
- 5. The Graph Price Prediction By BlockchainReporter
- 5.1. The Graph Price Prediction 2022
- 5.2. The Graph Price Prediction 2023
- 5.3. The Graph Price Prediction 2024
- 5.4. The Graph Price Prediction 2025
- 5.5. The Graph Price Prediction 2026
- 5.6. The Graph Price Prediction 2027
- 5.7. The Graph Price Prediction 2028
- 5.8. The Graph Price Prediction 2029
- 5.9. The Graph Price Prediction 2030
- 6. The Graph Price Prediction: Industry Experts
- 7. Is The Graph A Good Investment? When Should You Buy?
- 8. Conclusion
The Graph price prediction reveals that the token may soon retest its crucial support levels before sparking a fresh surge in the price chart.
Since Bitcoin‘s inception, the blockchain industry has become a playground for developers, investors, and organizations to test many projects. All these entities look to develop new financial tools and help everyone in the crypto sphere profit from them. However, hovering around a distributed ledger has become tricky for newcomers. Fortunately, innovative projects like The Graph which aim to simplify things for everyone. This indexing protocol seeks to enable developers to establish various APIs known as subgraphs for separate queries. This way, the protocol solves issues like security, the finality of property, and chain reorganization. Web3, or Web 3.0, is a vision of a decentralized global system but many projects that build on this premise still depend on centralized services. The Graph intends to provide a solution for decentralizing indexing databases and querying blockchain data to help several blockchain projects. The Graph price prediction seeks to bring its project analysis and expected future potential with an in-depth technical analysis of the current price trend to help you decide the best investment option amid the market turmoil.
The Graph Network: A Quick Overview
The Graph network is a decentralized data querying and indexing protocol that provides seamless data sharing across several blockchain applications. It is the first blockchain-based querying and indexing platform in the crypto space, and since its inception in 2018, it has hit uncountable billions of data queries. In April 2021 alone, the Graph executed over 20 billion data queries and has continued to gain more traction. It utilizes an ERC-20 standard token – GRT, which is the native token of the platform.
The Graph network was founded by Yaniv Tal, Brandon Ramirez and Jannis Pohlmann, and the developing team aims to take the Graph protocol to new highs. GRT token is used by developers to pay for queries made to the network and rewarded to those who contribute to the network by powering nodes that host application data (Indexers). Let’s find out its current market details to get a better view of the Graph price prediction.
| Cryptocurrency | The Graph |
| Ticker Symbol | GRT |
| Price | $0.057 |
| Price Change 24h | -11.14% |
| Market cap | $486,640,939 |
| Circulating Supply | 8,523,369,068 GRT |
| Trading Volume | $22,995,740 |
| All time high | $2.88 |
| All time low | No Data |
| The Graph ROI | No Data |
GRT: A Silent Killer
The Graph’s main use case is indexing data from Ethereum smart contracts so that it can be easily queryable by dApps. This lets dApps acquire the data they require without having to run their own full nodes or worry about sync times. After the establishment of the Graph mainnet, the project made a viable environment to ensure absolute decentralization for apps and ease access to data on the blockchain. With its introduction to open APIs, developers and other participants on the network can quickly and easily create subgraphs to query, index, and fetch information for various dApps. Furthermore, the network’s functionality depends on network nodes that execute a head-to-toe scan of the blockchain’s database.
Indexing guarantees the data structures used by dApps are defined. For efficient operations, the Graph requires the help of Indexers, Delegators, and Curators, all of whom make indexing services available to end-users, stake GRT tokens to run the Graph network and receive GRT tokens in reward payments for users’ contributions. The incentivization of the contribution by developers and other participants to the network ensures that they present accurate data and improve APIs. Also, end-users who query subgraphs get to pay GRT tokens to contributors via a payment gateway.
The Graph’s whitepaper states: “A large amount of data resides in silos that are centrally controlled by a handful of corporations. Web-era apps like Google, Facebook, YouTube, LinkedIn and Salesforce are built on these data monopolies. This centralization puts tremendous power into the hands of a few and reduces economic opportunity and self-determination for many. Decentralized applications (dApps) put users in control of their data.”
The GRT token plays a valuable role in the DeFi ecosystem resulting in many new users joining the platform. At the beginning of last year, the Graph platform announced additional support for blockchains like Polkadot, Solana, and Celo. Later in September, it hired thousands of indexers, delegators, and curators. The mission of The Graph Network is to make the blockchain network more convenient for developers to build decentralized applications that are powered by blockchain data. The Graph Network’s protocols will enable apps that are highly scalable, highly encrypted, and fast.
The Graph Price Prediction: Price History
Before digging further into the Graph price prediction, it is important for traders and investors to know about GRT’s past performance to get a better view of its future price potential. However, it is to be noted that GRT price history does not guarantee the Graph price prediction.
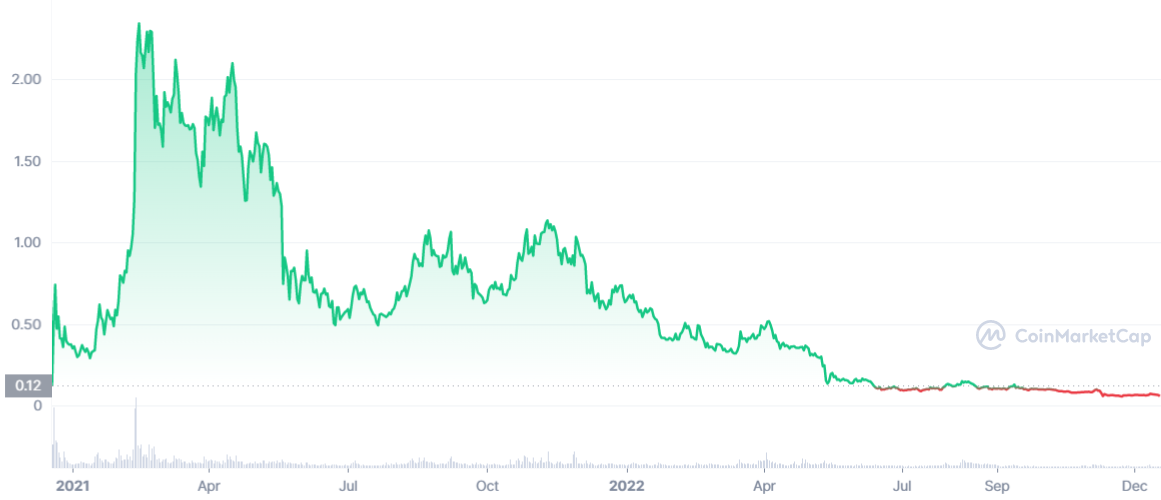
The Graph token launched into the crypto trading market with a value of $0.12 on 18 December 2020, and it immediately made an exponential surge to $0.74 by 21 December. However, the token went on a solid bearish note and continued to trade in a bearish consolidated range for the next two weeks and ended 2020 on a bearish note at $0.37.
The GRT token made a fresh start in 2021 as things started changing for the crypto market by Q1. The token started climbing in the price chart and rose to $2.3465 on 13 February 2021. GRT subsequently dropped to $1.3413 on 25 March 2021 before rising again to $2.1 on 15 April 2021. However, from April, the GRT token ignited its bearish mode and dropped to a low of $1.2 on 26 April. With a slight upward correction to $1.7, the GRT coin made a further drop and traded at $0.5 on 22 June. The Graph coin saw another pump in August as it continued to trade in the positive territory near the $1 mark. Volatility set in soon after, and the GRT price dropped to $0.6288 on 28 September 2021. Despite surging again at the tail end of the year to reach $1.2 on 9 November 2021, the price then swung to lows of $0.3594 on 24 January 2022.
In 2022, the crypto market got impacted by the pandemic, resulting in a severe price drop for major cryptocurrencies and the GRT token was no exception. Moving roughly in line with broader market activity, GRT suffered significant losses, and on 19 June 2022, it hit a new low of $0.09. There was initially an uptrend in the Graph price chart following the integration of the Cosmos Hub to The Graph, and by 20 June, the token was trading at around $0.11. But the descent continued, and GRT hit a new low of $0.086 on 13 July 2022. The downturn has been triggered by FTX’s collapse as the Graph price hovers below $0.06.
The Graph Price Prediction: Technical Analysis
The Graph token has been trading around a highly uncertain zone since its price plunged hard in November, and now the bearish trend has been sent to a death rally following the recent market turmoil accelerated by the collapse of the popular crypto exchange FTX. The GRT token sparked a new bearish trend on 10 December, with a drop of over 20%. However, the developing team behind the Graph platform promises an overwhelming future despite current market hurdles. Moreover, the Graph community looks promising about its expected future prices as the GRT token registers a remarkable price rally in the price chart. Our Graph technical analysis aims to bring an in-depth analysis of the current market trend with advanced technical indicators to help you choose the best profitable investment plan.
Observing the 1-day price chart of The Graph coin, the asset is poised to flash a solid bullish momentum after a minor downward retracement to 23.6% Fib retracement in the upcoming weeks. The GRT token has witnessed a significant price fluctuation this year and brought an immense bearish wave after coming across a massive selloff brought by whale investors due to recent market turmoil. The token began its bearish trend after making a fake breakout near its fundamental resistance level of $0.1 on 1 November.
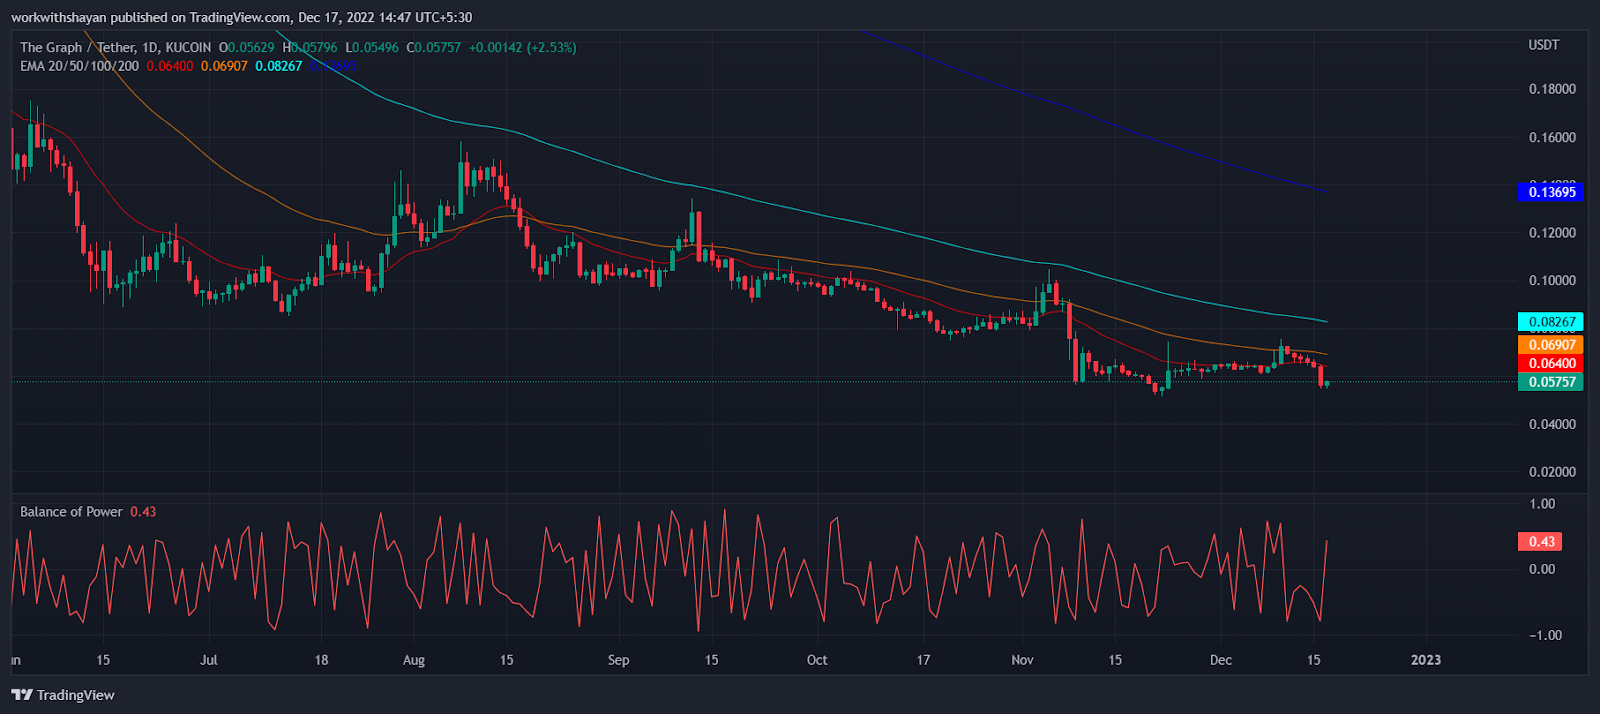
According to CoinMarketCap, the current Graph price trades at $0.057, with a downtrend of over 11% from yesterday’s price. After making a low of $0.051, The Graph formed support below its 0.31 Fib levels from its current price level. In the last few weeks, the crypto asset has made a huge price fluctuation in the altcoin market, but now it has vanished as the RSI-14 indicator is slowly heading toward the South after getting rejected at a bullish region of 62 and is currently moving around a negative territory of 38. However, the Graph seems to decline more in value as it formed a falling pattern in the last week and continues to trade downward, with a potential of dropping further. The BoP indicator trades in a slight positive region of 0.43, which may soon ignite an upward correction for Graph before sparking a bearish trend. However, the crypto market is expected to leave a bullish mark by the end of 2022 as the community develops positive news.
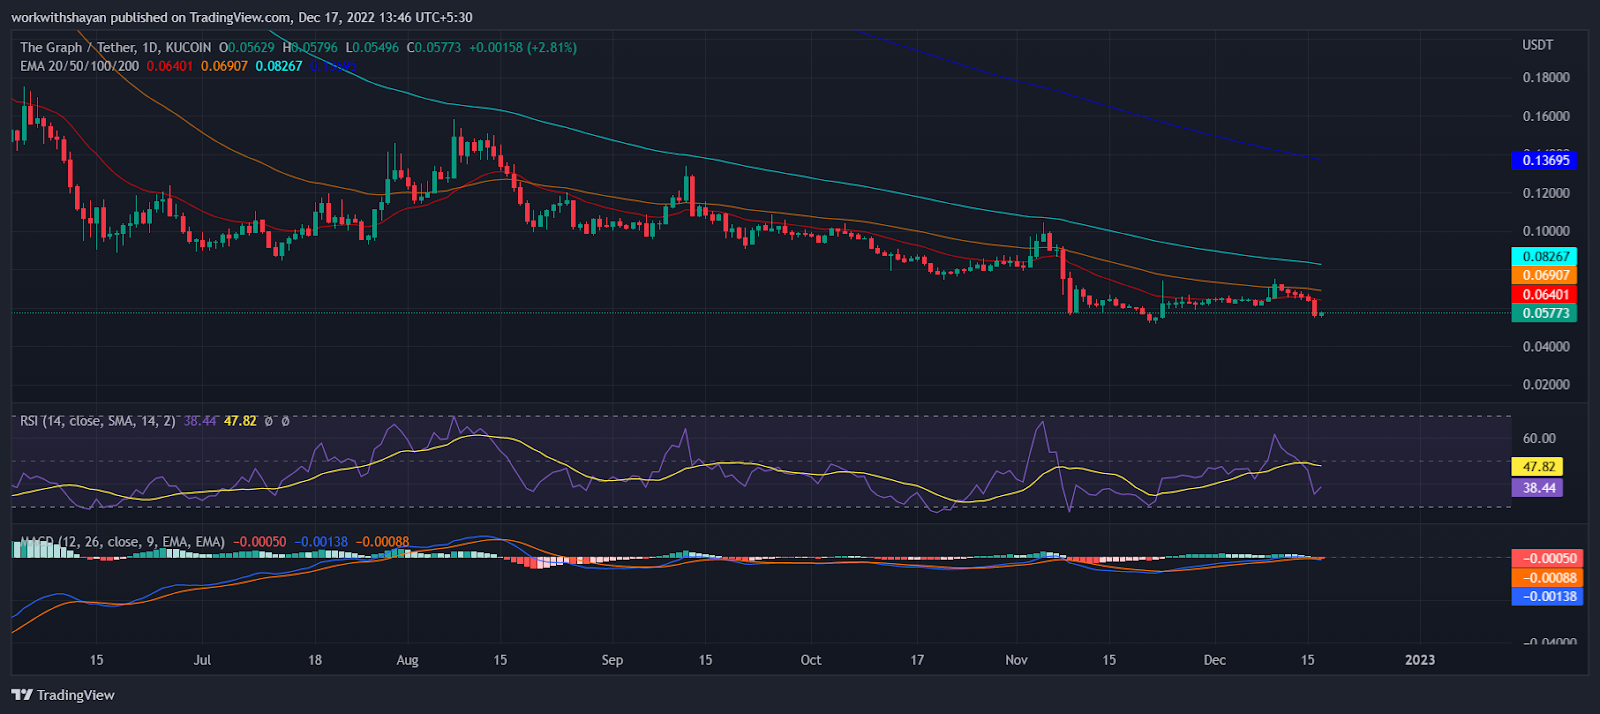
Our Graph technical analysis states that the market’s current downturn will soon be wiped out after a prolonged effect on multiple altcoins. Bulls are building intense buying pressure in the Graph price chart, which may send this digital asset to test its resistance level near the EMA-50 trend line at $0.07. Additionally, the MACD line attempts to hold its stability near the signal line as it trades parallelly for several days. The Bollinger bands are widening in the price chart as the lower limit is at $0.039, acting as a crucial support level. If GRT drops below $0.04, it can plunge hard and trade near the bottom level of $0.021. Conversely, the Bollinger band’s upper limit is at $0.08 near the EMA-100 trend line, above which the Graph token may skyrocket to its next resistance level of EMA-200 at $0.136. It is anticipated that the Graph token can retrace the downtrend to retest its support level at $0.04 before making any further upward movement to new highs by the end of 2022.
The Graph Price Prediction By BlockchainReporter
The Graph Price Prediction 2022
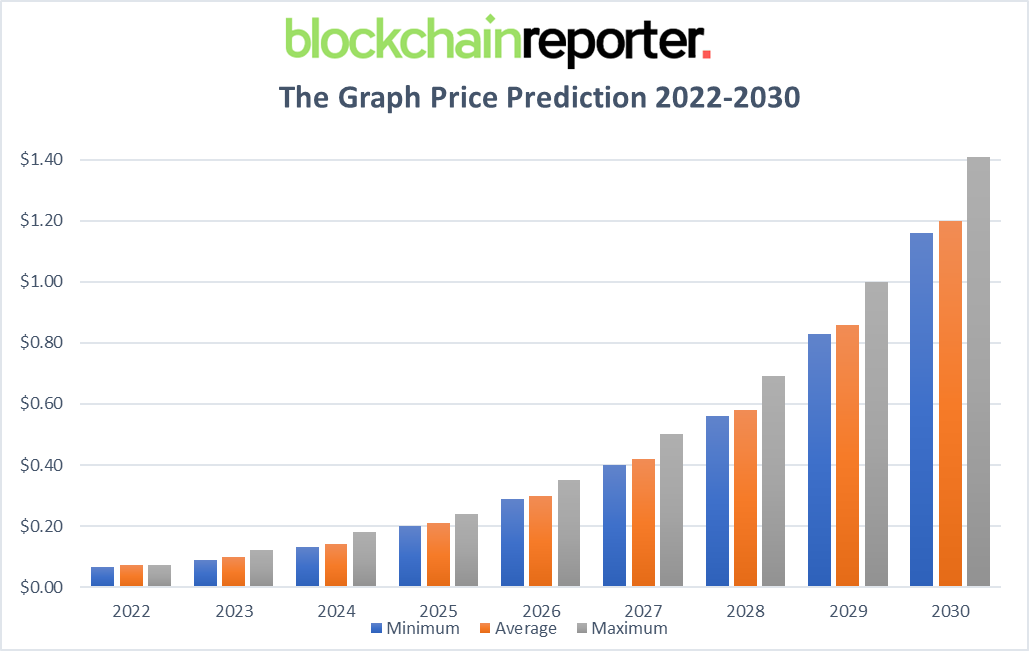
According to the Graph price prediction for 2022, the token is predicted to attain a maximum value of $0.073 with an average trading price of $0.071. However, our technical analysis reveals that the Graph can go as low as $0.065.
The Graph Price Prediction 2023
Our Graph price prediction for 2023 expects a maximum trading price of $0.12, with an average trading price of almost $0.1. The Graph might retrace downward with a minimum price of $0.09 by the end of 2023.
The Graph Price Prediction 2024
GRT boasts of developing solid and promising fundamentals for the crypto community. The Graph price prediction for 2024 predicts that the token will extend its bullish momentum and likely achieve a maximum price level of $0.18. After that, GRT crypto might record a low of $0.13, with an average trading price of $0.14.
The Graph Price Prediction 2025
Our Graph price prediction for 2025 anticipates a minimum value of $0.2 and a maximum value of $0.24. In addition, our Graph price forecast for 2025 predicts an average trading price of $0.21.
The Graph Price Prediction 2026
The Graph may witness an astronomical rise in 2026 and bring an astronomical return on investment to its long-term holders. Our Graph price prediction for 2026 expects a maximum trading price of $0.35 with an average trading price of $0.3. The Graph may trade at a minimum value of $0.29.
The Graph Price Prediction 2027
The crypto market may soon end the tears and tantrums and overcome its current hurdles as it is building potential for a bullish comeback and is expected to skyrocket in the next few years. Our Graph price prediction for 2027 suggests that it may touch a maximum trading price of $0.5. The Graph may trade at an average price of $0.42 with a minimum value of $0.4.
The Graph Price Prediction 2028
Our Graph price prediction for 2028 states that it may touch a maximum price of $0.69 and an average trading price of $0.58. The minimum value for the GRT cryptocurrency is predicted to hit $0.56.
The Graph Price Prediction 2029
In the upcoming years, the Graph may gain powerful partnerships due to its user-friendly environment that can push its price to the North. Our Graph price prediction for 2029 expects a maximum price for this token to be $1 and a minimum price of $0.83. GRT crypto may reach an average value of $0.86.
The Graph Price Prediction 2030
Depending upon the future market potential and response from the community, GRT coin can see a maximum price level of $1.41 with an average trading price of $1.2. However, the Graph is projected to hit the bottom level at $1.16 by the end of 2030.
The Graph Price Prediction: Industry Experts
According to Trading Beasts’ the Graph price prediction, GRT token price is forecasted to reach $0.0785152 by the beginning of February 2023. The expected maximum price is around $0.0981440, and the minimum price is $0.0667379. The Graph price forecast for the end of the month is $0.0785152. In 2025, the Graph token is poised to hit a minimum price of $0.1345924 and a maximum price of $0.1979300, with an average price of $0.1583440.
DigitalCoinPrice’s Graph price prediction states that the price of GRT is expected to surpass the level of $0.24 in 2025. By the end of the year, the Graph is expected to reach a minimum price of $0.22. In addition, the GRT price is capable of securing a maximum level of $0.26. In 2028, GRT is expected to exceed the level of $0.39. By the end of the year, The Graph is expected to reach a minimum value of $0.39. In addition, the GRT price is capable of attaining a maximum level of $0.41.
Is The Graph A Good Investment? When Should You Buy?
Despite a poor performance over the past few months, the protocol itself has a number of strengths that could help the Graph to push the price up in the future. The coin has a solid market cap, and there are several attractive developments that are either in their early stages or still in the pipeline. The developing team behind the Graph protocol is experienced and focused on leading the project’s goal with a bright roadmap, making it a good investment option. Our Graph price prediction suggests a buying opportunity at $0.03 for a stable return in the long term.
Conclusion
The developing team behind the Graph project is constantly looking for partnerships and actively working on adding more enhancements to the network. According to some experts, the Graph token will likely bring a ray of optimistic hopes to its long-term holders as it has a bright future ahead due to its robust fundamentals in the crypto space. The Graph token may even surpass $30 if it follows positive market momentum and brings more use cases to the crypto space.
However, the future price movement of GRT coins will solely depend on the market’s condition and users’ adoption of the network worldwide. BlockchainReporter advises investors to do their own research and conduct investment advice from experts’ opinions before investing in the highly volatile crypto market.


