Bitcoin price analysis
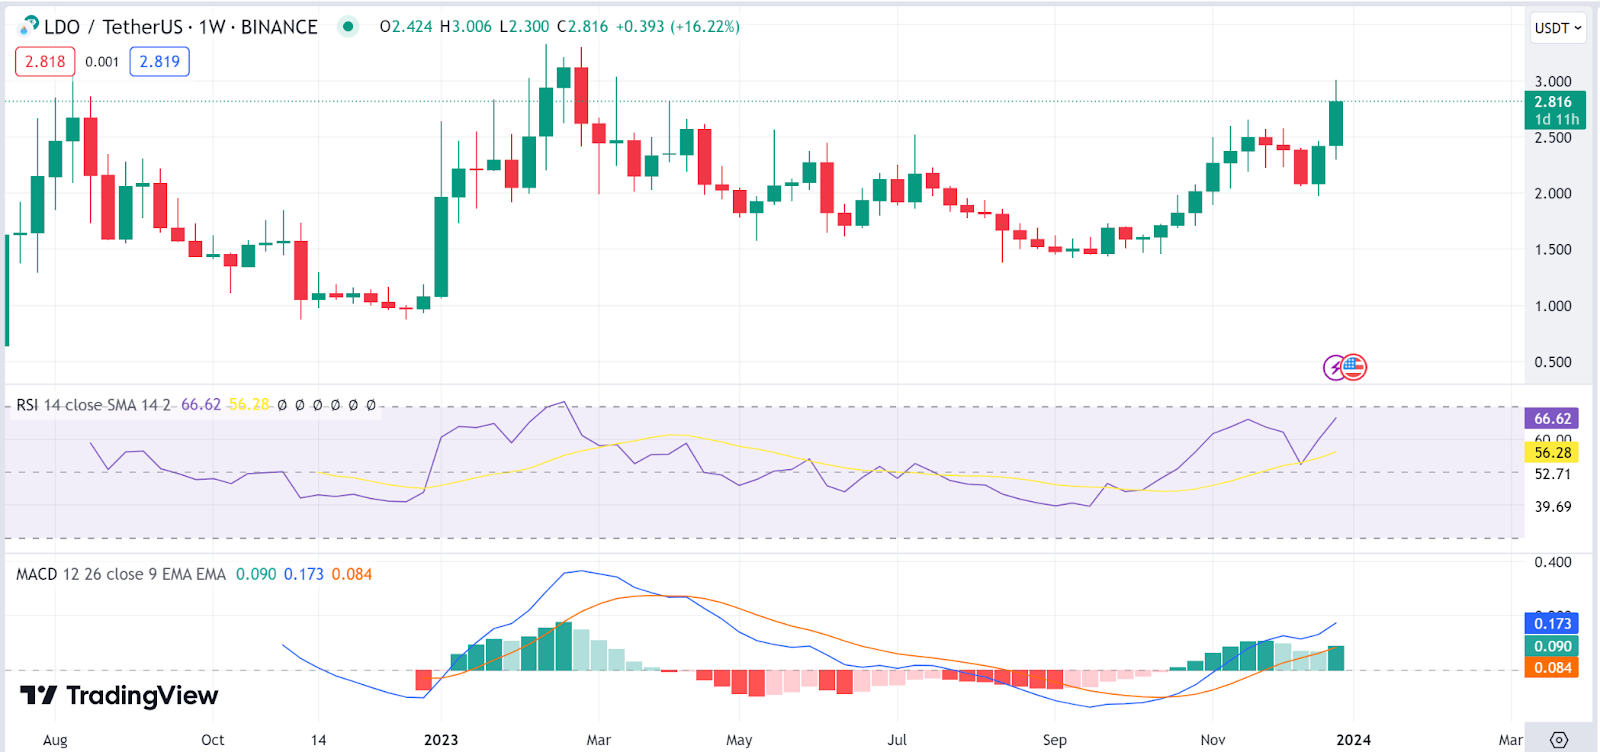
Bitcoin has had a slow week as it failed to register gains from its previous seven-day price. As of press time, the Bitcoin price stood at $41.9K, representing a drop of 3.9% in the last seven days. The market cap stood at $822 billion.
Looking at weekly charts, the Relative Strength Index indicator is now moving south as it approaches an exit from the overbought region, showing bearishness on the crypto king. The MACD indicator is also reverting towards the red zone, showing fading bullishness as the Bitcoin price could plunge in the long term.
BNB price analysis
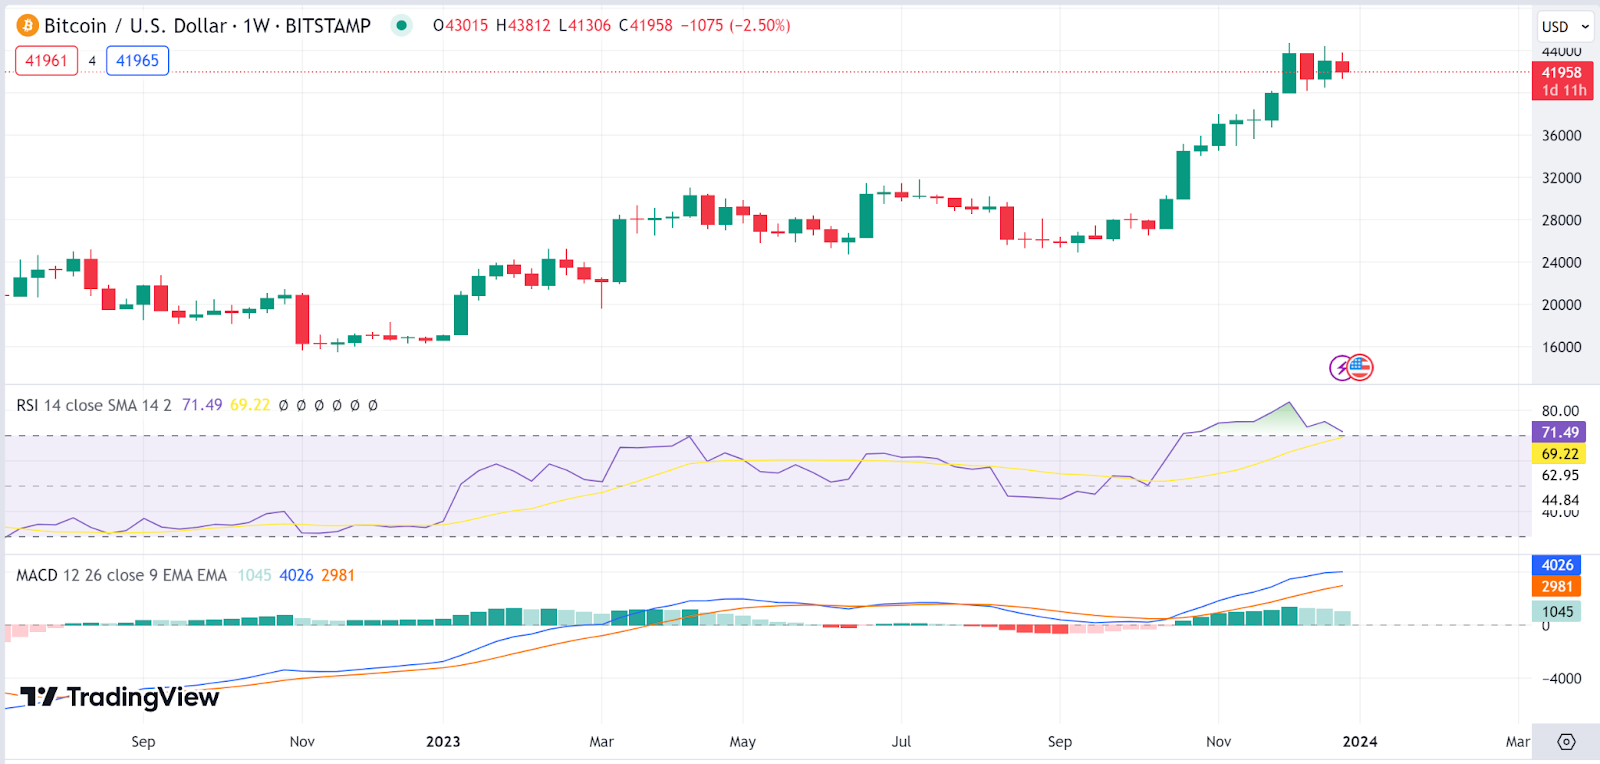
BNB has, however, had a good week as it appears among the top gainers over the period. As of press time, the BNB price stood at $317.3, representing a jump of 18% in the last seven days. The market cap stood at $48.1 billion.
Looking at weekly charts, the Relative Strength Index indicator is now moving north as it enters the overbought region, showing bullishness on the crypto king. The MACD indicator is also moving in the green zone, showing buying pressure on the token as the BNB price looks to continue pumping.
Bitcoin Cash price analysis
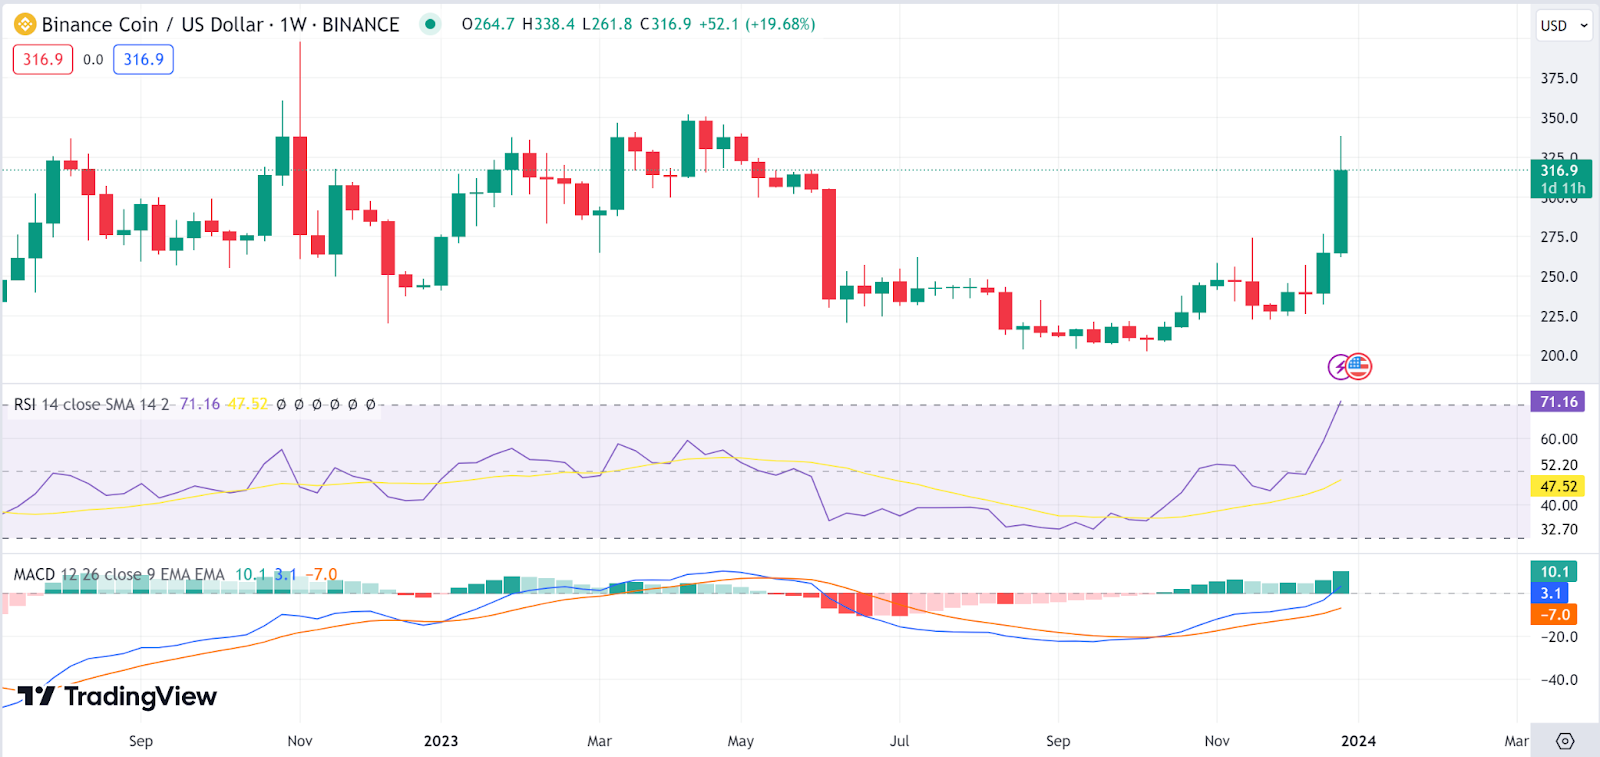
Bitcoin Cash (BCH) is the second gainer of the week. As of press time, the Bitcoin Cash price stood at $275, representing a jump of 18.3% in the last seven days. The market cap stood at $5.3 billion.
Looking at weekly charts, the Relative Strength Index indicator is now moving north as it approaches the overbought region, showing bullishness on the Bitcoin Cash price. However, the MACD indicator is in the red zone, indicating some uncertainty on the Bitcoin Cash price future trajectory.
Uniswap price analysis
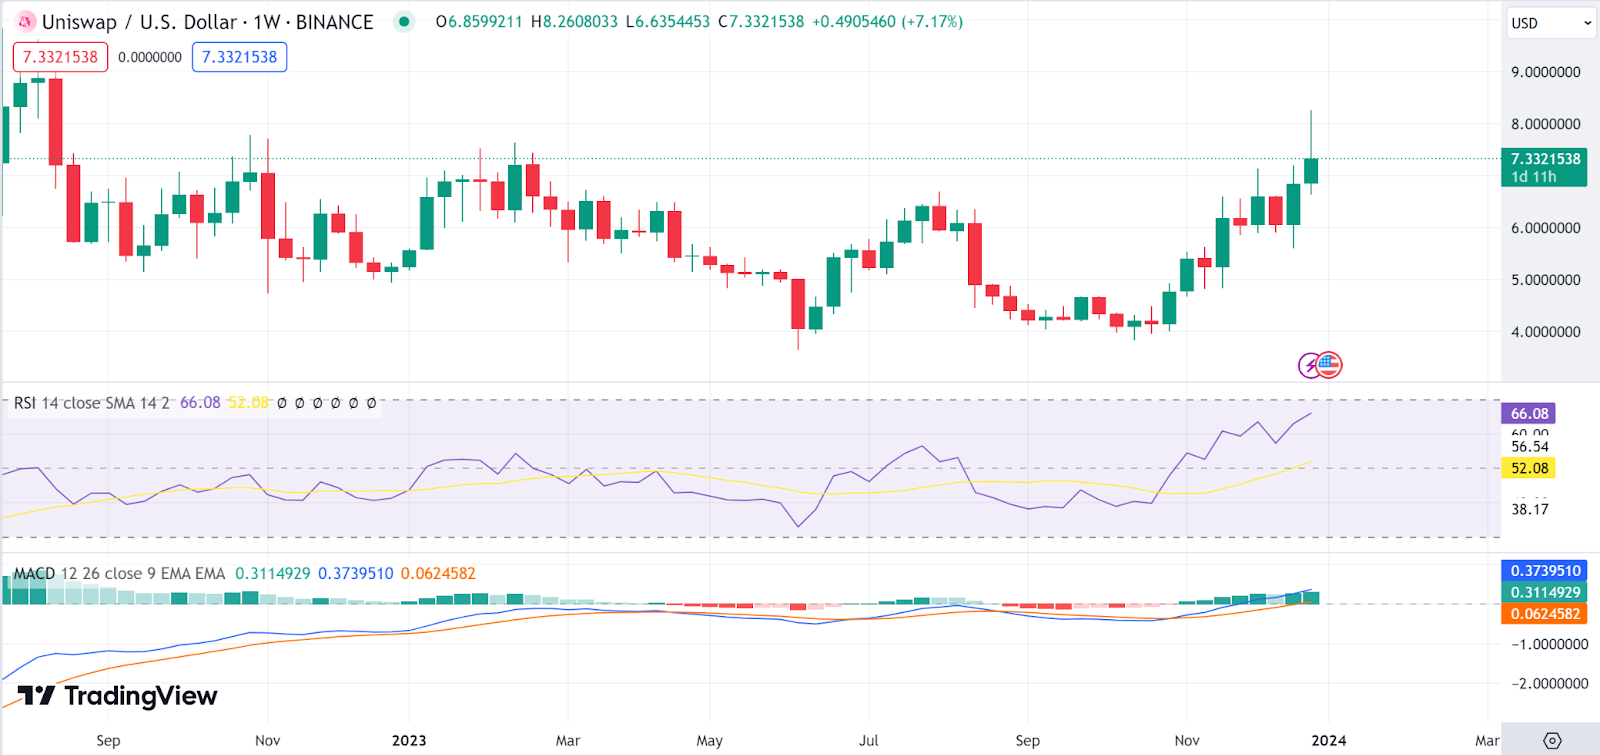
Uniswap (UNI) has also managed to increase its value to appears among the top gainers over the period. As of press time, the Uniswap price stood at $7.3, representing a jump of 18% in the last seven days. The market cap stood at $4.4 billion.
Looking at weekly charts, the Relative Strength Index indicator is now moving north as it approaches the overbought region, showing bullishness on the Uniswap price. The MACD indicator is also moving in the green zone, showing buying pressure on the altcoin.
Lido DAO price analysis
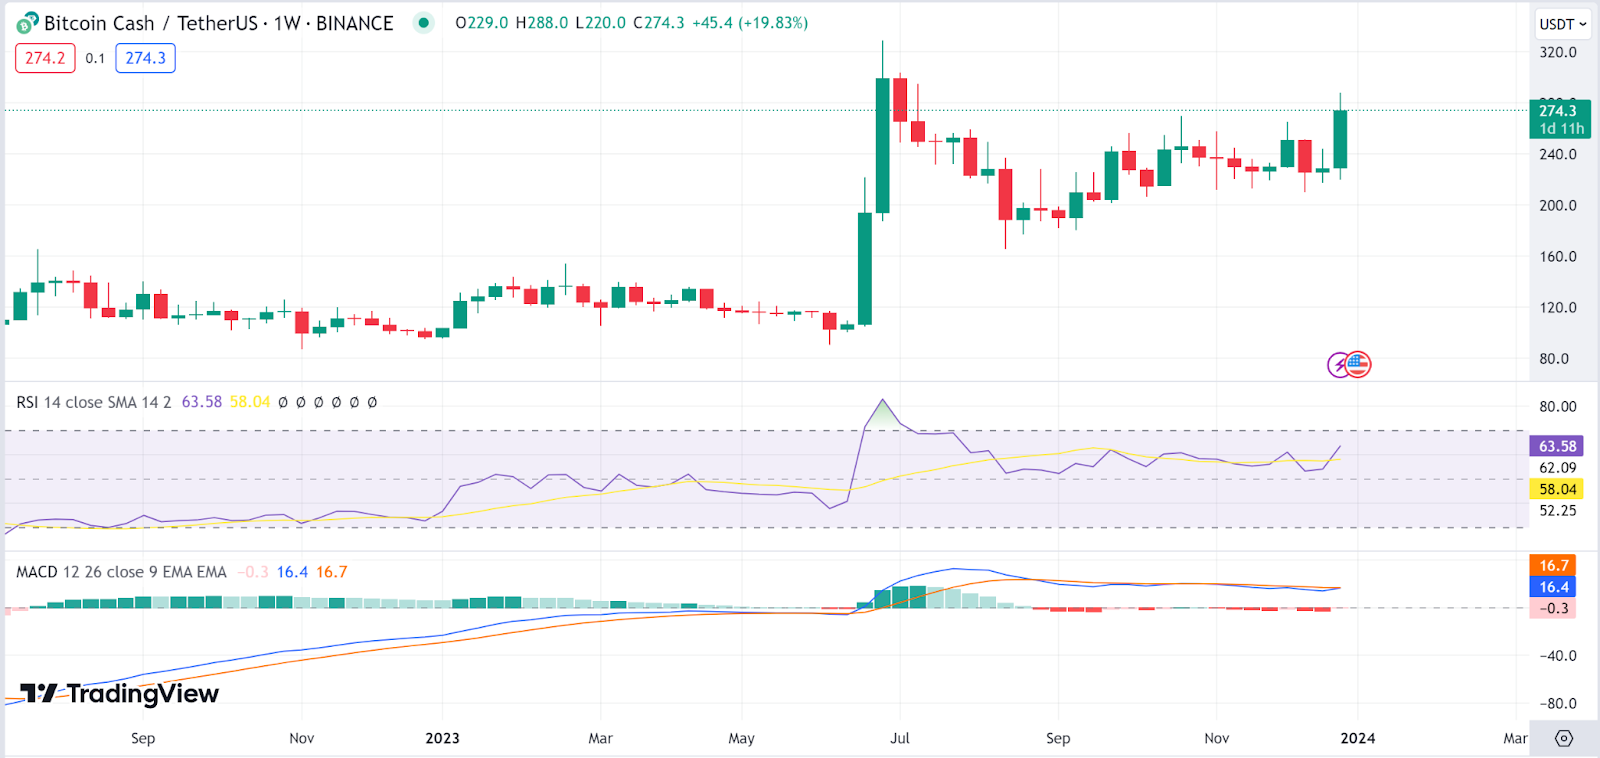
Lido DAO (LDO) closes our top gainers list of the week. As of press time, the LDO price stood at $2.8, representing a jump of 21.3% in the last seven days. The market cap stood at $2.5 billion.
Looking at weekly charts, the Relative Strength Index indicator is now moving north as it approaches the overbought region, showing bullishness on LDO. The MACD indicator is also moving in the green zone, showing buying pressure.
