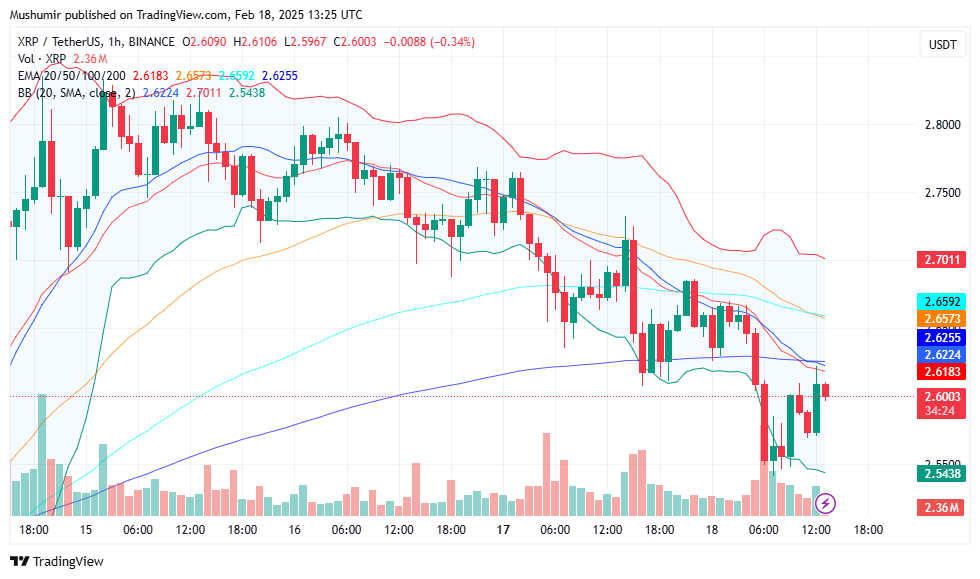
In the last 24 hours, XRP’s price dropped by 2.20%, settling at around $2.6015 USD. Over recent sessions, XRP has traded within a relatively tight range. Intraday lows have been observed near $2.55 USD, while the price has reached intraday highs of approximately $2.65 USD. This narrow trading range shows a phase of consolidation where the balance between buyers and sellers is nearly equal.
XRP Price Analysis

Based on recent TradingView data, XRP’s 50‑day moving average (MA) is estimated to be around $2.63 USD, while the 200‑day MA is roughly $2.57 USD. With XRP currently trading at $2.6015 USD, it hovers slightly above its 200‑day MA but is near the 50‑day MA. This positioning suggests that while the longer-term trend remains supportive, there may be short-term pressures that need to be overcome for further gains.
Trendline analysis further highlights crucial support and resistance levels. Recent swing lows have established a support zone around $2.55 USD, while resistance appears to be forming near $2.65 USD. If XRP can break above the resistance level, it may signal the return of bullish momentum. Conversely, a failure to hold the support level could lead to further downside pressure, making these technical levels vital for predicting the next price move.
Moreover, Bollinger Bands are widely used to gauge volatility by creating dynamic support and resistance zones around the current price. Currently, XRP’s Bollinger Bands are relatively tight, which indicates that volatility is low during this consolidation phase. Historically, such a “squeeze” in volatility is often followed by a breakout once the market receives a significant catalyst.
Volume is a critical factor in confirming the strength of a move. Recent trading volumes for XRP have been moderate, which is typical during periods of consolidation. A significant increase in volume—especially if XRP approaches or breaks above the resistance level at $2.65 USD—would add credence to any breakout signal. Conversely, if volume remains subdued, the current consolidation may continue until a strong directional move occurs.
XRP Price Prediction
Based on the technical analysis, the near-term price prediction for XRP on February 18, 2025, can be outlined by three potential scenarios:
- Bullish Scenario:
If XRP manages to hold support near $2.55 USD and breaks above the resistance zone at around $2.65 USD, bullish signals from the MACD crossover and moving averages could propel the price upward. In this scenario, XRP might rally to a target range of approximately $2.70–$2.75 USD by the end of the trading day. A surge in volume accompanying the breakout would further support this upward move. - Neutral/Consolidation Scenario:
In the absence of a strong directional catalyst, XRP is likely to continue trading within its current consolidation range, roughly between $2.55 USD and $2.65 USD. This outcome would indicate that the market is in a holding pattern, with buyers and sellers maintaining a near balance as they wait for further news or technical signals. - Bearish Scenario:
If selling pressure intensifies and XRP fails to hold the support level near $2.55 USD, the price could decline further, potentially falling to around $2.50 USD or lower. This outcome would suggest that bearish sentiment is prevailing in the short term, at least until a new catalyst emerges to drive a reversal.
Given the current technical environment—characterized by a neutral RSI, early bullish MACD signals, and moderate trading volume—the most balanced XRP price prediction on February 18, 2025, is that it will likely trade within its current consolidation range. However, if buying interest increases and XRP breaks above its resistance, a modest rally pushing the price to the $2.70–$2.75 USD range is a strong possibility.
Frequently Asked Questions (FAQs)
Which technical indicators are important for predicting XRP’s price?
Key technical indicators include the 50‑day moving average (around $2.76 USD) and the 200‑day moving average (approximately $2.70 USD), as well as support levels near $2.55 USD and resistance around $2.65 USD. Additionally, the RSI (currently in the 52–56 range) and the MACD (showing early bullish signals) are critical, along with Bollinger Bands and volume trends.
Where can I buy XRP?
XRP is widely available on major cryptocurrency exchanges such as Binance, Coinbase, Kraken, and Bitstamp. These platforms offer XRP trading pairs with various fiat currencies and other digital assets, making it accessible for both retail and institutional investors.
What is today’s forecast price for XRP?
Today’s short-term forecast suggests that if XRP holds support near $2.55 USD and breaks above the resistance at approximately $2.65 USD, it could rally to a target range of $2.70–$2.75 USD by the end of the day. If not, it is likely to continue trading within the current consolidation range.
Investment Risk Consideration
Investing in cryptocurrencies such as XRP involves inherent risks due to their volatile nature and sensitivity to market sentiment. Investors should conduct thorough research, diversify their portfolios, and adopt robust risk management strategies when trading or investing in volatile assets like XRP. Consulting with financial professionals before making any investment decisions is highly recommended.


