- Bitcoin faces key support test at 21 EMA amid market-wide cooling.
- Active addresses decline, signaling reduced retail engagement.
- Exchange outflows point to long-term holding despite price volatility.
Bitcoin is facing a major moment in its current market cycle, with price action, technical indicators, and on-chain data pointing to growing pressure on both momentum and investor sentiment. As of press time, the cryptocurrency was trading at $77,312.21, following a 2.31% daily drop.
The decline, which reversed gains from earlier this month, comes amid broader market cooling, reduced trading volumes, and a major test of long-standing support levels.
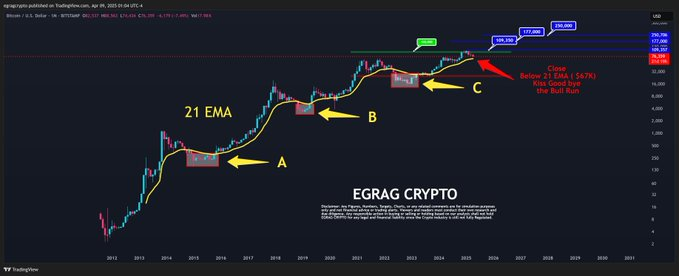
EGRAG CRYPTO, a crypto analyst, shared a technical analysis emphasizing Bitcoin’s interaction with the 21-month Exponential Moving Average (EMA), currently around $57,000. Historically, this EMA has served as a key support line during bull markets. Bitcoin has repeatedly bounced off this level during past corrections, preserving its broader uptrend.
According to EGRAG’s projections, holding this support could allow for three possible outcomes: a retracement toward $97,000, a rally to $177,000, or an expansion scenario that could push the price as high as $280,000. However, a close below the EMA would indicate a structural breakdown, possibly signaling the end of the bull run.

Activity Drop and Exchange Outflows
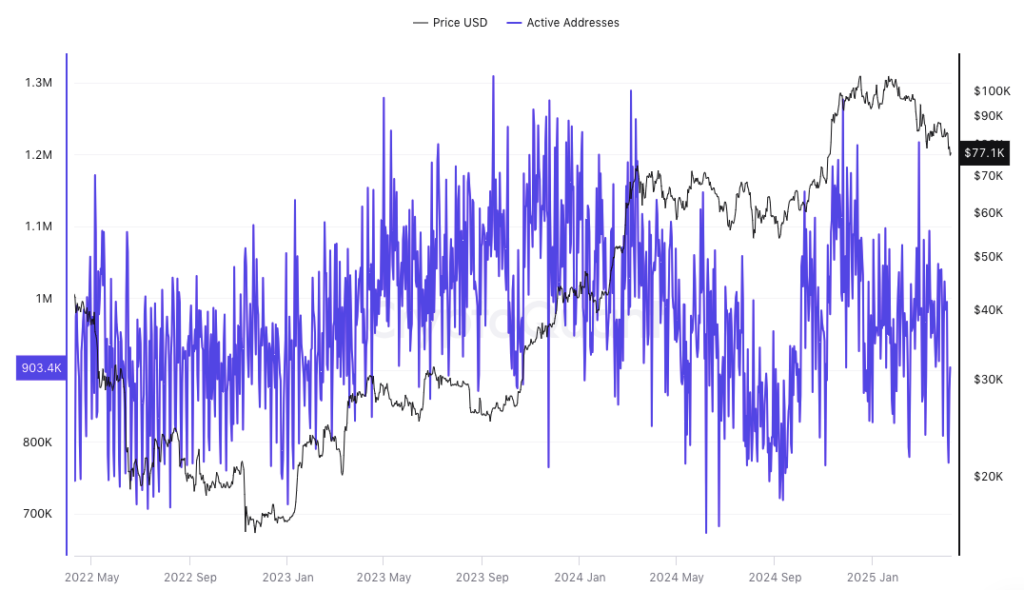
While technical indicators remain in focus, on-chain data presents a contrasting picture. Despite Bitcoin’s growth from under $20,000 in early 2023 to nearly $100,000 in late 2024, the number of active addresses has steadily declined.
Current figures show active addresses at around 900,000, down from over 1.2 million during peak retail engagement in 2023. This divergence between price and user activity points to waning participation from smaller investors and reduced network usage.

The drop in address activity may be linked to shifting market dynamics, with institutional investors increasingly dominating the space. These entities generally transact at a higher unit volume with fewer addresses involved, hence they have lower address counts. While this trend may indicate market change, it raises concerns about the likelihood of pegging the price rally at such a low user participation level.
At the same time, exchange data adds another layer to the current market narrative. CoinGlass reports show net outflows from spot Bitcoin exchanges, particularly since late December. Specifically, more than $1 billion of investments were poured out in March, while the BTC price was above $73,000.

Despite recent volatility and declining address activity, the consistent movement of Bitcoin off exchanges suggests reduced sell-side pressure. If this accumulation trend continues, it could hedge against short-term corrections.


