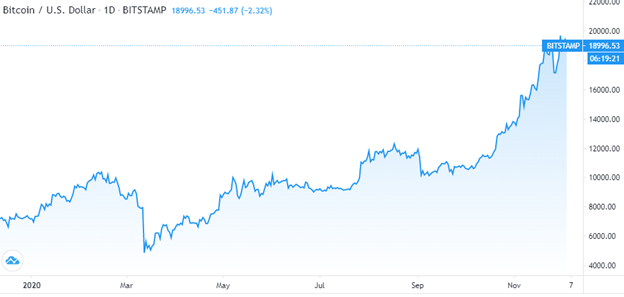
Bitcoin finally managed to surpass its previous price record just a few days ago after it established an all-time high of $19,825 on Monday.
Bitcoin’s rally has now driven its price up by more than 400% from its mid-March lows of $3,858. Since 2017, this marks the second time bitcoin came very near to testing the $20,000.
Rather than a rejection and bear market following the ATH milestone, this time around, Bitcoin’s most profitable buy signal has just triggered, according to BTC expert Charles Edwards. This fundamental tool suggests that this year’s high returns are just the start of what is to come.
BTC Price Approaches Critical Resistance Level
At the time of writing, Bitcoin is trading down over 2% at its current price of $18,995, marking a massive climb from its recent lows of $18,200 set earlier this week.

BTCUSD Chart By TradingView
The lows came shortly after the cryptocurrency surged past $19,800 and endured a heavy rejection. Selling pressure generated around the recent peak lot has led to bouts of volatility in the BTC markets.
it remains unclear whether the next test of the critica $19.5K resistance level will allow the king coin to crack the $20K resistance.
Analyst Claims Bitcoin is Growing Stronger
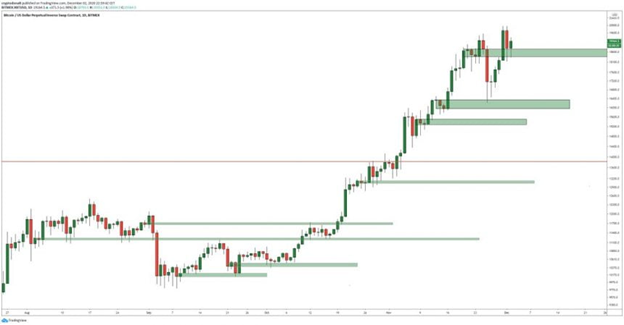
According to renowned crypto trader Crypto DonAlt, Bitcoin is gaining strength the longer it holds above the mid-$18,000 region.
“Any low timeframe bullishness hinges on that support level which so far seems to be holding,” the analyst explained, noting the importance of the the $18.3-$18.7 area:

BTC Price Chart With Analysis from CryptoDonAlt | Source: TradingView
Whether Bitcoin can stay firmly above the mid-$ 19,000 marks should give investors an idea of where it will trend by the end of the year. A healthy break above $19,475 or a drop below $ 18,875 can trigger a decision-making move for the benchmark cryptocurrency.
When considering this volatile price action, investors should beware of fake breakthroughs at all costs and seek additional affirmation such as high volume. BTC traders should note that consolidations seen below crucial resistance levels often signal that an asset is ready to break out.


