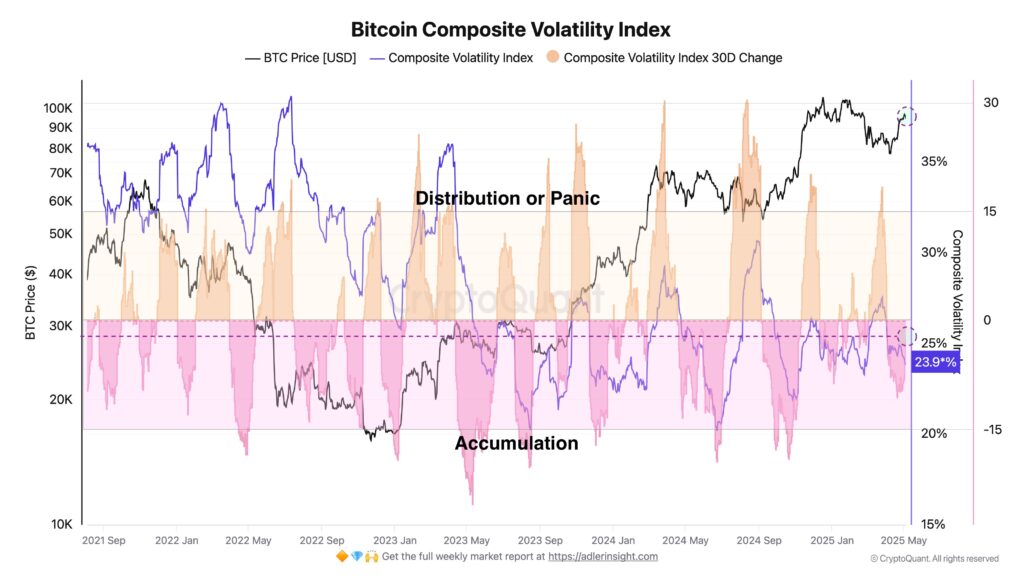
- Bitcoin enters accumulation phase as 30-day CVI change drops to –3.5%.
- CVI remains below 25%, signaling reduced volatility and market stability.
- No panic signs as address activity supports long-term holder confidence.
Based on recent analysis of address activity and the Composite Volatility Index (CVI), Bitcoin’s volatility metrics are showing clear signs of a new accumulation phase. A continued decline in volatility, coupled with stabilizing price trends, has placed Bitcoin in a historically consistent pattern of long-term accumulation, according to data shared by analyst Axel Adler Jr.
On May 5, Adler reported that the 30-day change in CVI had dropped to –3.5%. This figure, derived from Bitcoin address activity, is one of the indicators used to classify macro market phases.
According to Adler, the market typically enters an accumulation phase when the 30-day change falls below 0%. However, if the percentage rises above +15%, it indicates the beginning of distribution or panic selling. With current data on Bitcoin being below zero, the data quite clearly places Bitcoin in a long-term accumulation window.
CVI Sits Below 25%, Reinforcing Market Stability
The broader Composite Volatility Index also supports this interpretation. At 23.9% as of early May, the CVI stayed within the accumulation zone, visually marked in pink on CryptoQuant’s tracking chart. Historically, this range has aligned with market stability and long-term positioning by strategic investors.
The black line on the chart shows how Bitcoin’s price rose to just under $95,000. Another noteworthy factor is how strongly all volatility indicators (shown in blue and orange) drop from previous highs. The pattern is like a cooling period within the market, and speculative trading activity tends to slow down.

Periods when the CVI dipped below 25% in previous cycles, such as mid-2023 and late 2024, were often followed by sustained consolidation. In many of those cases, accumulation led to renewed upward price movement after a phase of market stabilization.
Distribution and Panic Phases Defined by Spikes
On the other hand, higher volatility levels above 25%, especially when they increase sharply, have previously marked market exits and investor panic. The orange-shaded part on the CVI chart often matches sudden sell-offs or macroeconomic stress events.
The lack of an upward spike in the current CVI implies that market participants are not being forced to flee positions aggressively. Instead, the current environment is more suitably tuned for steady accretion, as evidenced by volatility metrics that indicate less uncertainty and cooler trading.
Strategic Accumulation Underway as Market Awaits Next Move
However, low volatility and a negative 30-day change indicate that the long-term holders maintain enormous confidence. These conditions are historically conducive to more sustainable price movements as speculative activity slows.
There’s no reason to assume that increased accumulation will surge the market immediately, but patterns from history show that low-volatility times tend to run up before more dramatic ones. The data shows Bitcoin sis till consolidating just shy of its peaks without any panic in the market.


