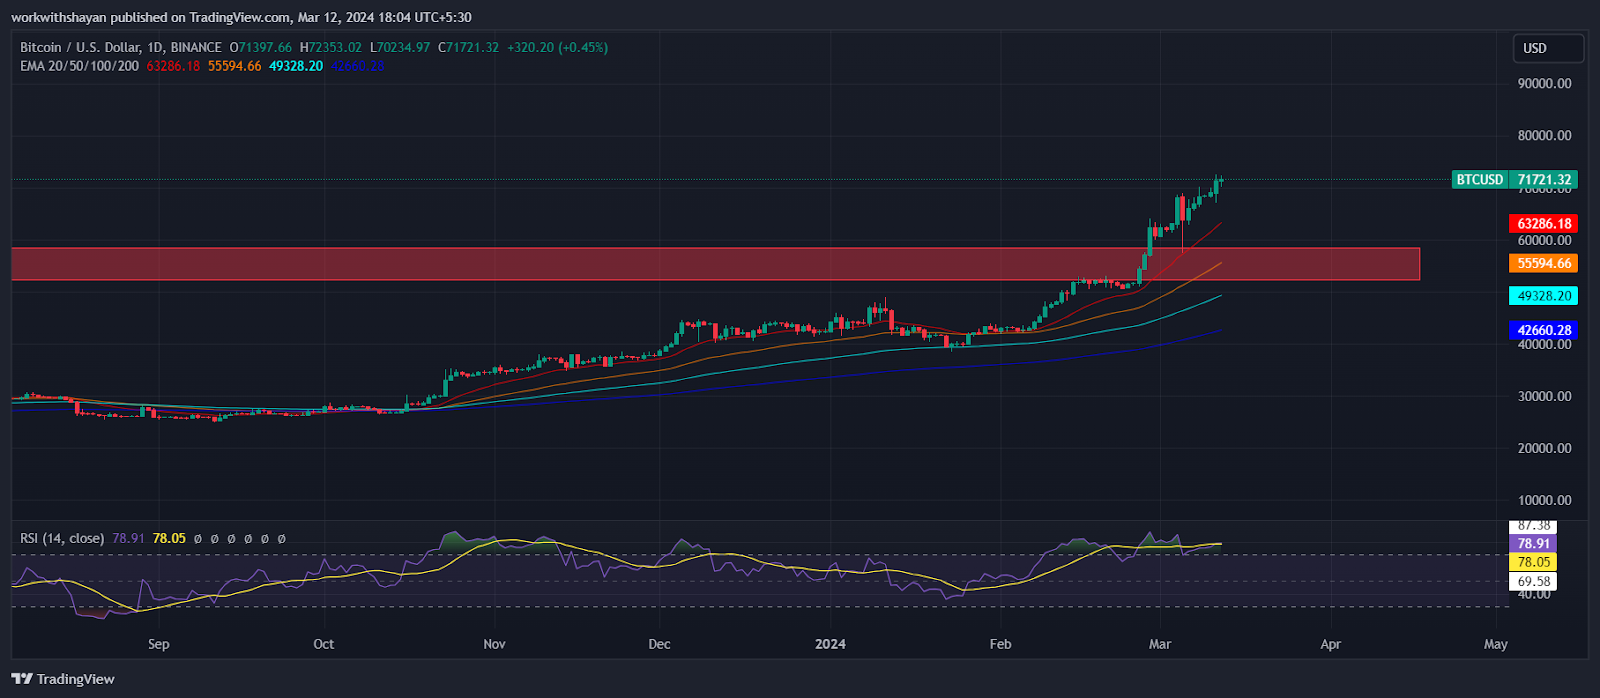
The momentum behind *BTC* surge seems unrelenting, with the cryptocurrency consistently surpassing key resistance levels to achieve new all-time highs. This upward trajectory is being fueled by increased adoption and recognition from institutional investors, including notable figures like Michael Saylor, boosting bullish sentiment around Bitcoin’s value. This surging confidence is driving a powerful rally in Bitcoin’s price. Yet, as Bitcoin makes its ambitious march toward the $100,000 milestone, significant sell-off activities by whale investors have been observed. This trend has led to a notable decline in the number of whale addresses in recent days, raising concerns over the potential impact on Bitcoin’s price stability.
Bitcoin Might Be Overheated Right Now
Industry insiders assert that Bitcoin’s journey as a choice for institutional investment allocations is only beginning, especially as spot Bitcoin exchange-traded funds (ETFs) in the United States start to gain traction. With their value nearing $30 billion, these Bitcoin ETFs have emerged as the most triumphant launch in ETF history. If this upward trend continues, it could lead to a scenario where the demand for Bitcoin outstrips the available supply.
At present, there’s concern that Bitcoin’s price may be reaching excessively high levels as investors continuously acquire more Bitcoin during each downturn, while sellers remain largely inactive during its upward trajectory.
Consequently, should Bitcoin continue its surge but encounter even a slight downturn, it could trigger a significant sell-off among these holders, leading to a pronounced long squeeze. Such a development is deemed essential for tempering the currently overheated market sentiment reflected in the Bitcoin price chart and for bringing stability to its momentum.
According to Ali Charts, there has also been a decline in whale addresses in recent weeks as large holders holding above 1000 Bitcoins recently cashed in during the market peak. Over the last two weeks, there has been a near 5% drop in the number of addresses holding more than 1,000 bitcoins, signaling a major sell-off that has caught the attention of investors and analysts.
This trend shows a cautious or perhaps profit-taking approach among Bitcoin’s largest holders following the cryptocurrency’s recent price surge. The reduction in whale addresses could have multiple implications for the Bitcoin market. Analysts are debating whether this sell-off indicates a peak in Bitcoin’s current price cycle or if it’s merely a strategic move by whales to capitalize on the price surge.
Ali observed the Bitcoin price surpassing the $71,700 mark, cautioning short-term traders about the potential for an upcoming reversal. Ali highlighted this by sharing a chart in which the TD sequential indicator flagged a sell signal on Bitcoin’s 12-hour chart.
Since January 23, Bitcoin has experienced a consistent upward trend, following the dissipating “sell-the-news” reaction to the introduction of spot Bitcoin ETFs. These novel Bitcoin investment vehicles have attracted substantial capital since their launch on January 11, with their assets under management escalating to $55.3 billion by March 11.
This influx of investment has triggered signs of an overheating market in Bitcoin trading circles. CryptoQuant analysts are now alerting the community that, despite Bitcoin reaching new heights, it might be gearing up for significant corrections.
What’s Next For BTC Price?
Over the weekend, Bitcoin struggled to surge above the resistance zone of $68,000-$70,000 but broke this zone recently due to intense accumulation. As a result, the BTC price touched the $72,500 mark but faced a minor rejection near that level. Currently, BTC price trades at $71,863, surging over 0.28% from yesterday’s rate.

BTC/USD 4-Hour Chart On TradingView
The upward trend in moving averages and an overbought RSI indicate that the buying side dominates. Though sellers are defending the BTC price near $72K, buyers might soon overcome that level. The BTC/USDT could surge to $76,000 and possibly $80,000, where it is expected to encounter significant resistance.
As Bitcoin price is now well above its previous ATH, there’s no resistance in its upward trajectory and it now totally depends on trading sentiment. The initial indication of a downturn would be a breach and closure below the 20-day EMA, suggesting the buyers are taking profits and potentially triggering a more substantial correction.


