
Bitcoin has surged to the critical $50,000 milestone, fueled by the robust performance of the U.S. stock markets and significant investments into Bitcoin-specific exchange-traded funds (ETFs).
Many experts are bullish about the ongoing upward trend. However, several analysts have issued a note of caution to investors on social media, pointing out that the percentage of Bitcoin’s total supply that is currently in profit is approaching 95%, a level that often brings a decline.
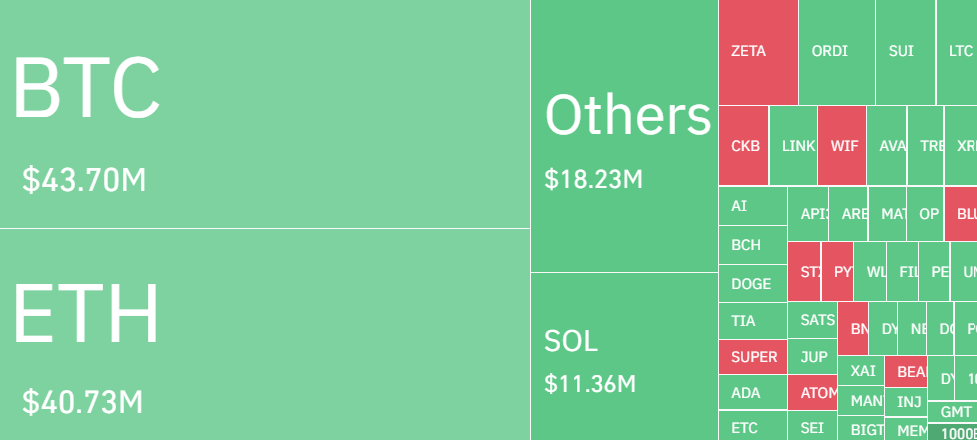
Despite the potential for short-term setbacks, the outlook for *BTC* remains positive over the longer term. Glassnode indicated in a post that certain on-chain metrics suggest Bitcoin might be at the early stages of a bull market.
Could this upward trajectory of Bitcoin also lift certain altcoins? Let’s dive into the charts to explore this possibility.
Ethereum (ETH) Price Analysis
Attempts by bears to hinder Ether’s recovery were observed around the 61.8% Fibonacci retracement mark of $2,700, but bulls are strongly defending a decline below immediate Fib channels. As of writing, ETH price trades at $2,616, declining over 1.6% from yesterday’s rate.
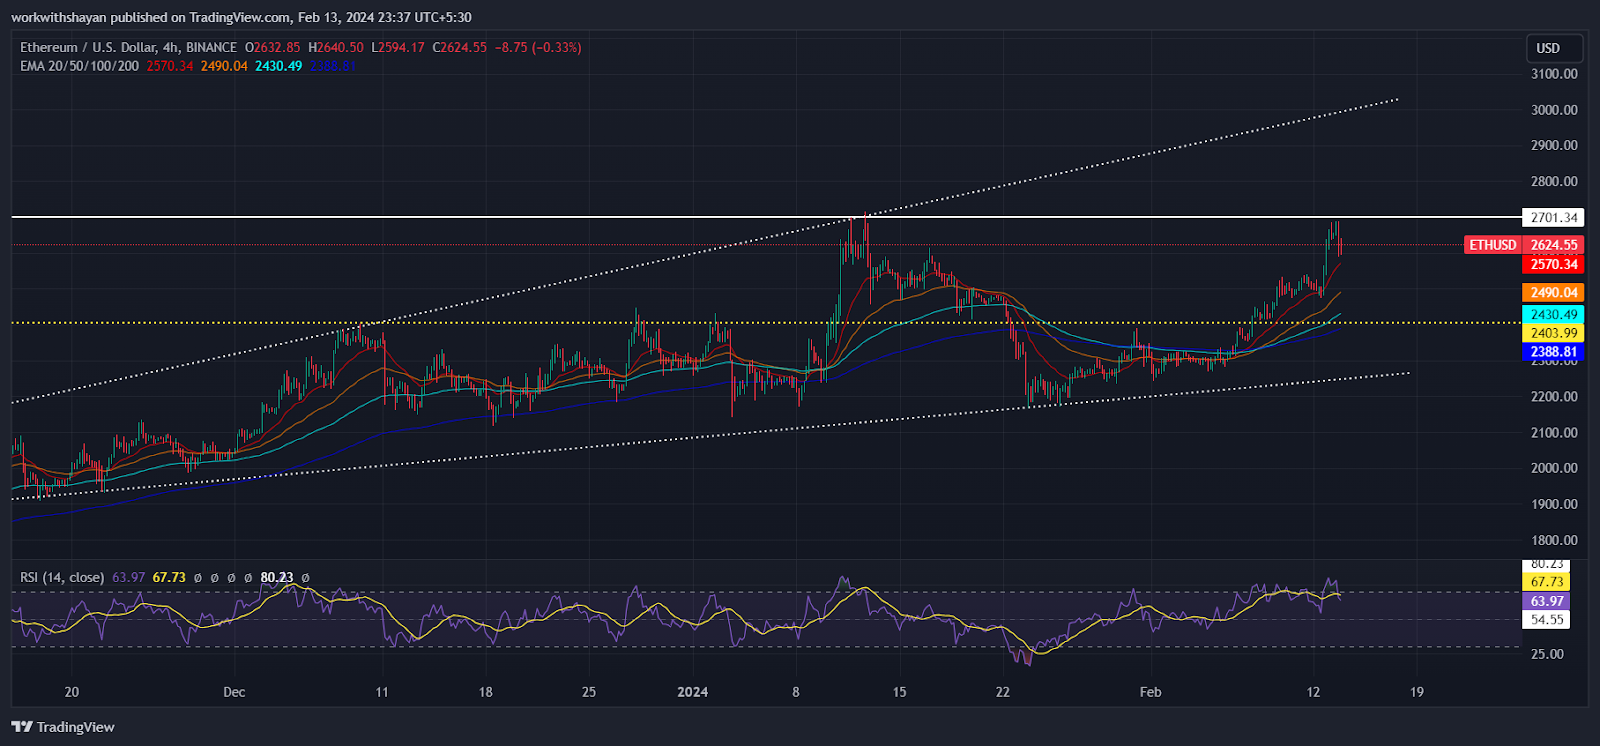
The upward trend of the 20-day Exponential Moving Average (EMA) at $2,640 and the Relative Strength Index (RSI) declining from the overbought region suggest that the volatility is stabilizing. If *ETH* surpasses $2,700, it might consolidate within $2,900-$3,000.
The critical support level to keep an eye on is at $2,400. Should this support be breached, we might see an escalation in selling, potentially driving the price down to a significant support level at $2,250, where it is anticipated that buyers will mount a strong defense.
Aptos (APT) Price Analysis
APT’s attempt to recover is being met with resistance at the 20-day Exponential Moving Average (EMA) of $9, suggesting a negative sentiment as traders opt to sell during price rallies.
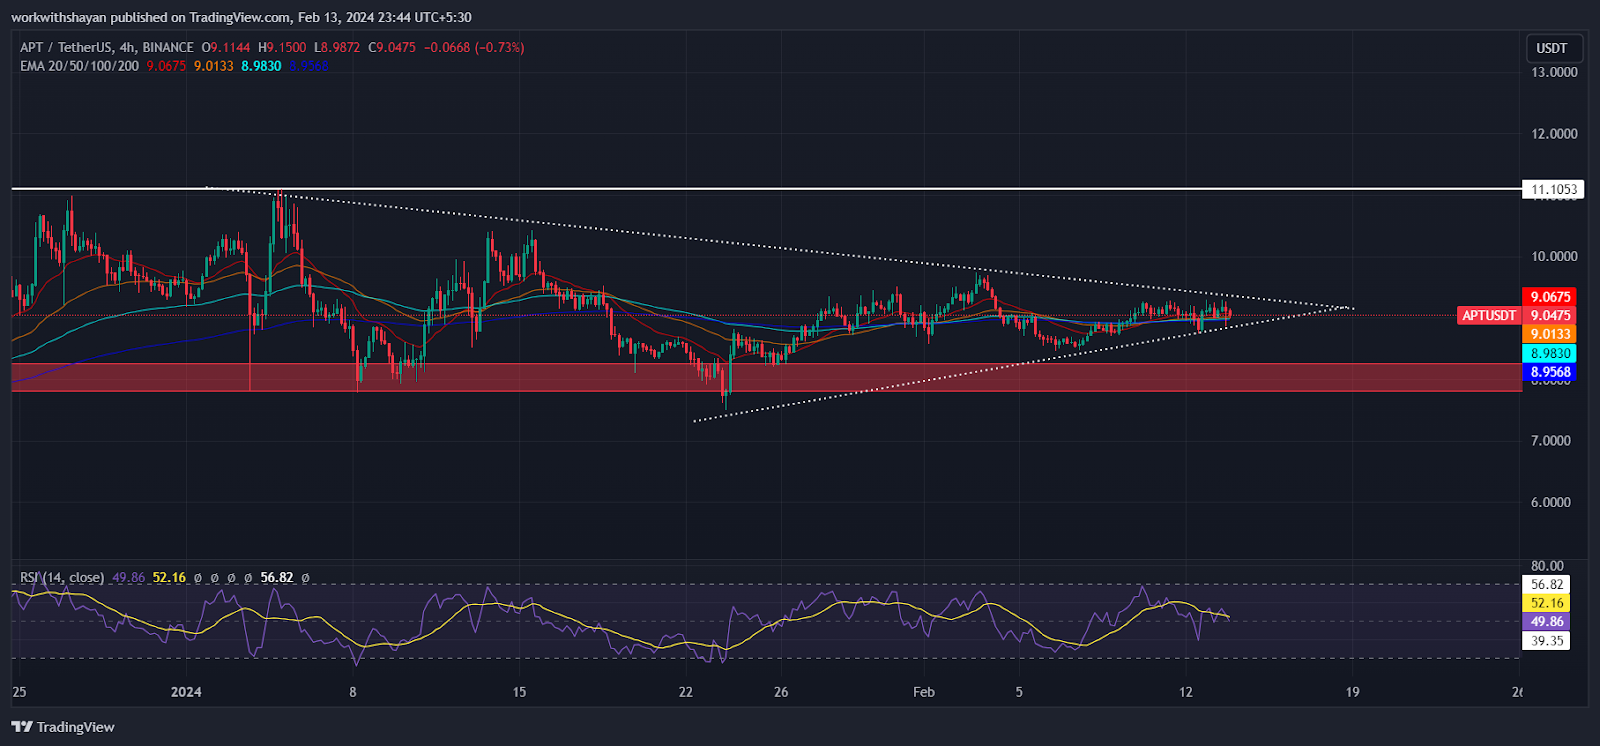
Should the price decline from its current position, the bears will aim to push and keep the price beneath the solid support level of $8.8. Achieving this could lead the APT/USDT pair to fall towards the vital support at $7.9, where it is anticipated that buyers will robustly defend the level.
Conversely, a breakthrough and sustained closure above the 20-day EMA would signal a shift towards strength. Following this, the APT price might ascend to the descending trend line, poised to be a significant obstacle for the bulls. Surpassing this resistance could pave the way for a potential surge to $11.1.
Internet Computer (ICP) Price Analysis
ICP has been oscillating within a symmetrical triangle pattern for several days, reflecting a standoff between buyers and sellers.
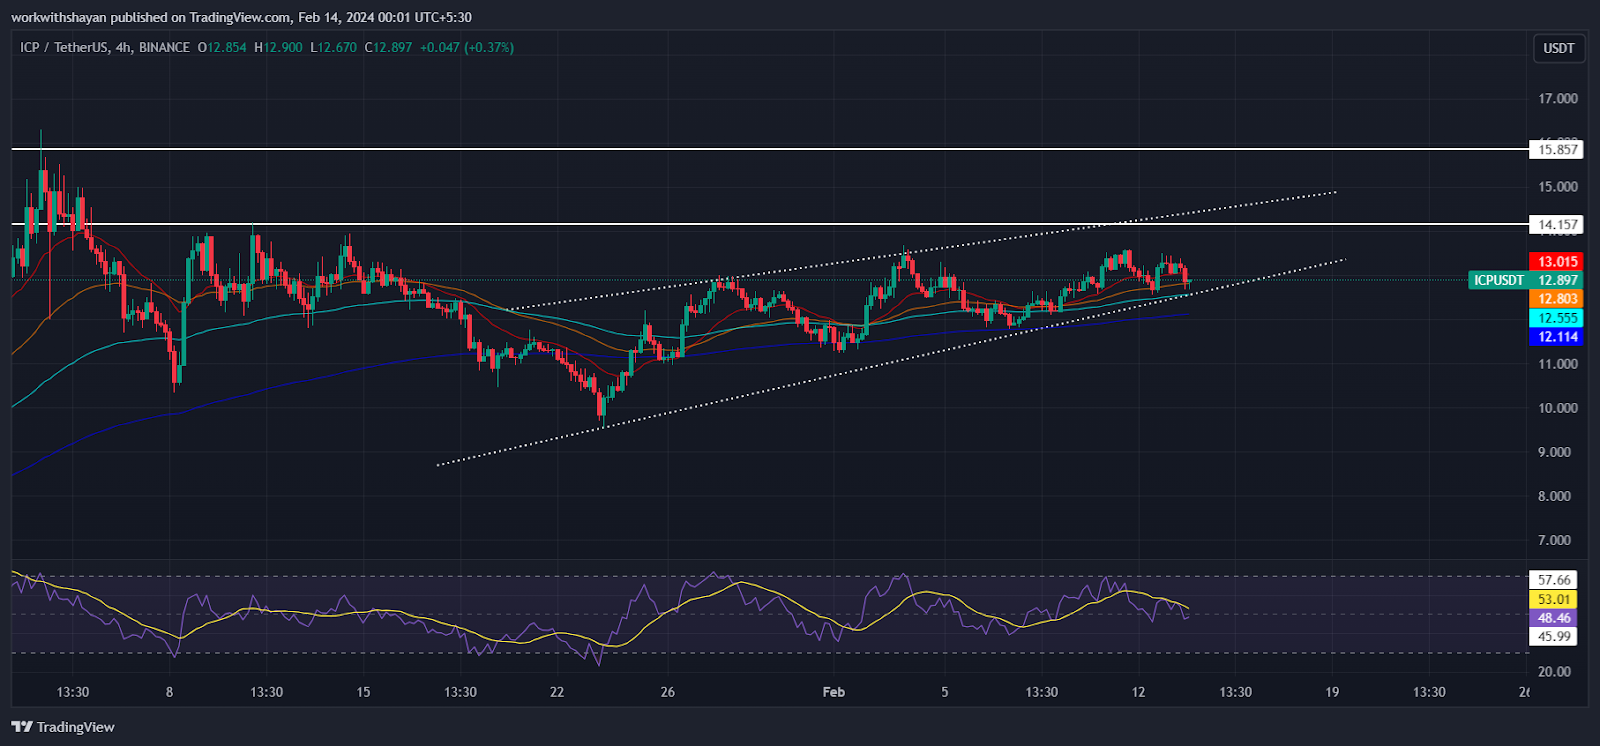
The 20-day Exponential Moving Average (EMA) at $13 is leveling off, and the Relative Strength Index (RSI) hovers around the midpoint, suggesting an equilibrium in market forces. To seize control, buyers need to push the price out of the triangle’s confines. Following this breakout, the ICP/USDT pair could aim for a surge towards the resistance zone between $14 and $16.
Conversely, if sellers manage to drive and keep the price beneath the triangle’s uptrend line, it could trigger a decline towards the firm support level at $9.8, and possibly extend to $9. This level is expected to witness vigorous defense from buyers.
Optimism (OP) Price Analysis
Optimism is currently at a critical juncture, with buyers and sellers contesting the price near the EMA20 trend line.
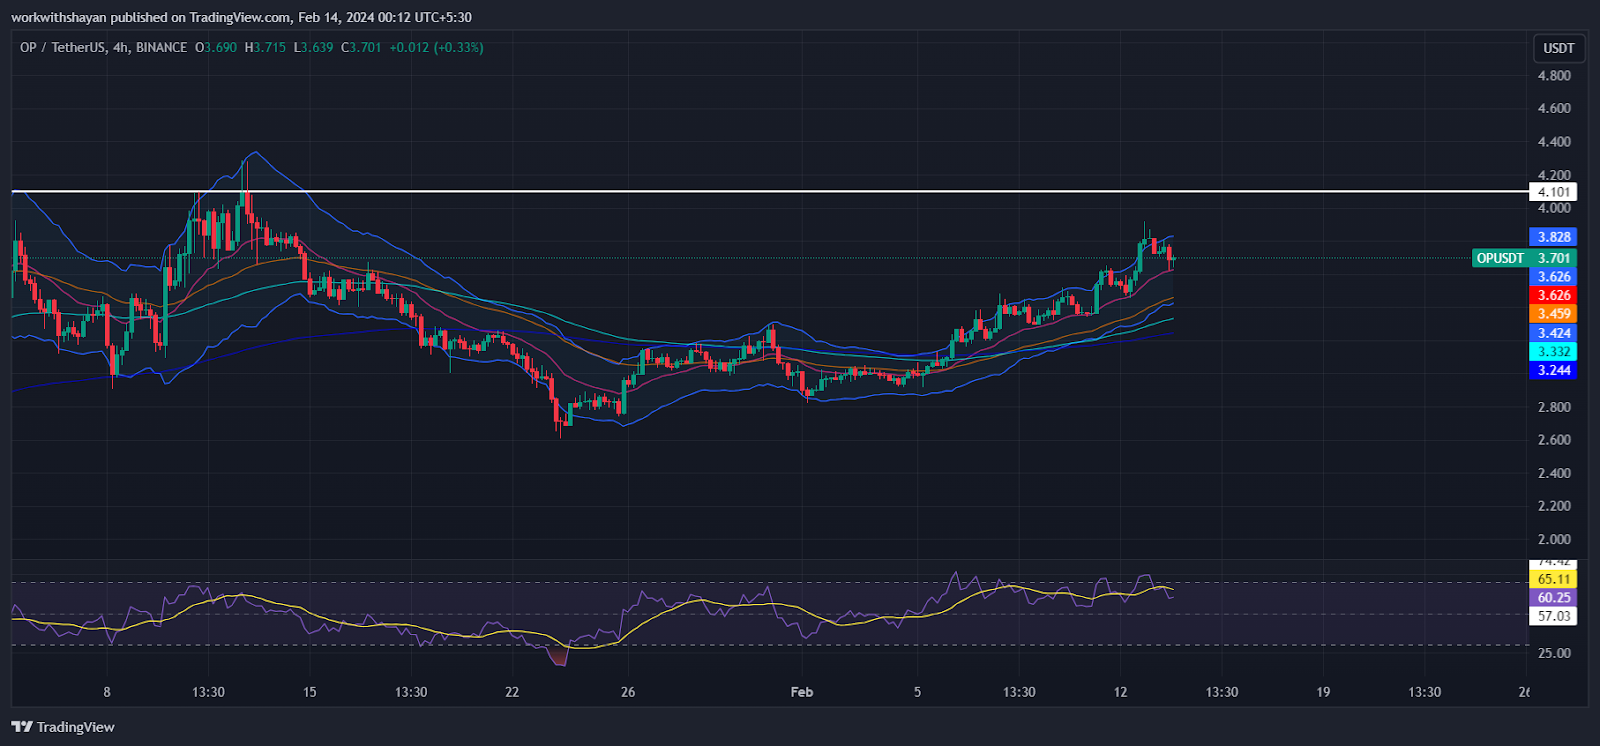
The bulls managed to push the price above $3.3, yet they struggled to capitalize on this breakout the following day near $3.9. The bears attempted to seize control by pushing the price below immediate Fib channels, but the bulls stood firm and strongly defended, indicating strong buying interest at lower levels. The aim for buyers is to drive the OP/USDT pair towards $4.1.
On the flip side, the bears are plotting to pull the price back under the moving averages. Succeeding in this effort could see the pair tumble to the crucial support level at $3.2, a level which buyers are keen to protect. Failing to hold this line could lead to a further decline to $2.9.
IOTA Price Analysis
The bulls successfully pushed IOTA beyond the neckline of its inverse head and shoulders (H&S) pattern and are now working to hold onto these gains amidst a retraction near $0.27.
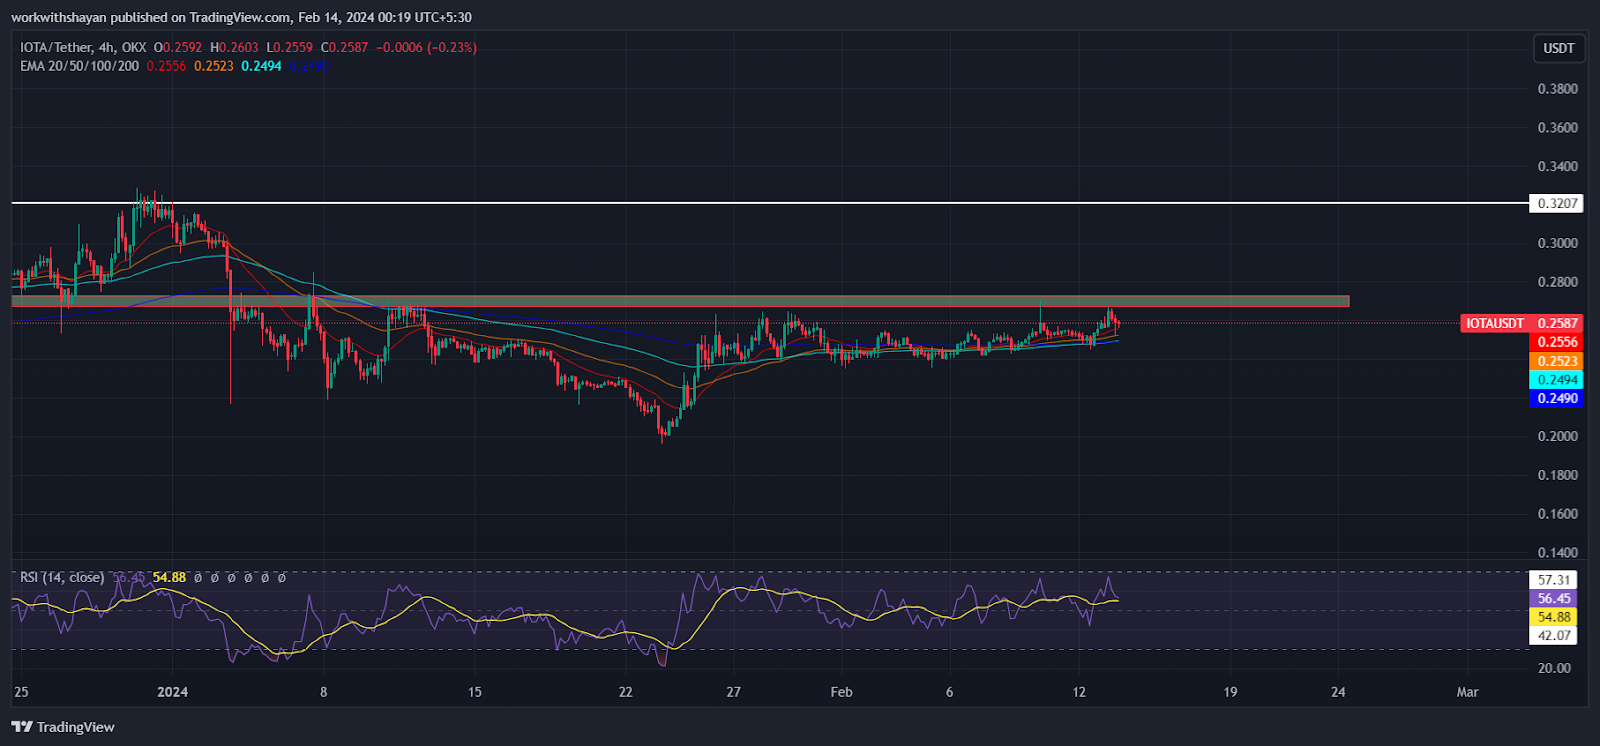
Should the buyers keep the price north of $0.27, the IOTA/USDT pair could quickly move up to $0.32, followed by a potential rise to $0.35. Surpassing this barrier would indicate that the upward trend is set to continue, with $0.4 as the subsequent bullish target.
On the other hand, a sharp decline and fall below the moving averages would suggest that the breach above $0.27 might have been misleading, setting a trap for the bulls. Under such a scenario, the pair could drop to $0.23, and possibly further down to $0.2.

