Bulls have awoken in today’s session, as the global market had risen by 0.4 % from the previous trading day, bringing the total to $1.17 Trillion as of press time. CoinMarketCap also reports that the fear and greed index is at a neutral 52 as things continue to improve.
Bitcoin (BTC) analysis
With a daily rise of 0.5% and a weekly decline of 2.2%, Bitcoin (BTC) is now trading at $29.2K, remaining below $30K as bear activity reduces. While this happens, Bitcoin’s trading volume has reduced by 35% and is now at $10.4B.
Now that the Bollinger bands have begun to diverge somewhat, we may infer that Bitcoin’s volatility is growing. Bears continue to struggle for market dominance, as shown by the Relative Strength Index (RSI) currently below its average line.
Ethereum (ETH) analysis
Ethereum’s (ETH) is also moving positively as the asset trades 0.7% from the previous 24-hour price to now trade at $1859, while trade volume is down 39% to $4.1B as of press time. Bollinger bands for ETH continue to stay close together, indicating little volatility.
However, the Relative Strength Index (RSI) is still below its average line, signaling that Ethereum will likely experience a bearish trend as the asset’s bears strive for market supremacy. The MACD indicator is also still in the red zone.
Dogecoin (DOGE) analysis
At the time of writing, Doge’s price had increased by 7% within a day, to $0.07931, putting it at the top of the trending list, and it had increased by 15% within a week. In the same time frame, trade volume for Doge has dropped by 18% as network activity decreases.
The Bollinger bands for Doge are now splitting from one other in response to an earlier surge in trading volume. The MACD also moves higher, indicating bullish momentum, and the RSI still hovers close to the overbought zone.
Trust Wallet Token (TWT) analysis
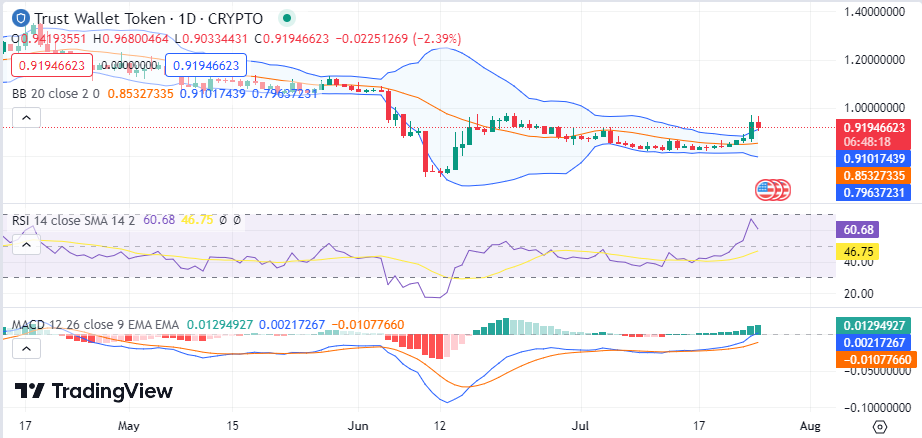
TWT likewise is still showing notable gains, trading 1.6% higher than 24 hours ago to reach $0.923. This compares to a weekly gain of 11%. During the same period, TWT’s trade volume increased by 0.6%.
Volatility for TWT is still rising as Bollinger bands diverge and the Relative Strength Index (RSAI) rises above its average line, indicators of bullish momentum. The MACD signal also strolls in bullish territory, suggesting that bulls are in control.

X (X) analysis
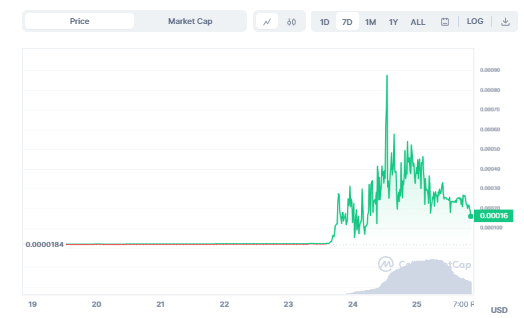
X is having a bearish session as the asset faces massive corrections ahead of a recent rally it saw. Now trading at $0.0001457, the asset moves 75% below its 24-hour price but remains 692% above its previous week’s price. The asset’s trading volume has also dropped by 57% as activity on the token now fades.

X’s recent surge resulted from Twitter’s logo to an “X”-like a symbol that saw many bulls act on the coin, causing it to surge big, attributing to the asset’s 7-day gain as shown in the chart above.


