Bitcoin’s price surged over 10% to reach a new high for 2024, hitting $64,000 on February 28. This significant increase, marking a 50% rise in price over the month, is largely credited to investors’ expectations surrounding the forthcoming supply halving event. Historically, such events have often led to a robust upward movement in price. As a result, altcoins such as *ETH* touched their yearly peaks as ETH price touched the much-anticipated level of $3,500, last reached in 2021. However, ETH price is facing a surge in bullish leverage positions along with bearish on-chain metrics, which might trigger a short-term correction for the altcoin.
Bitcoin’s $60K Surge Pushes The Market
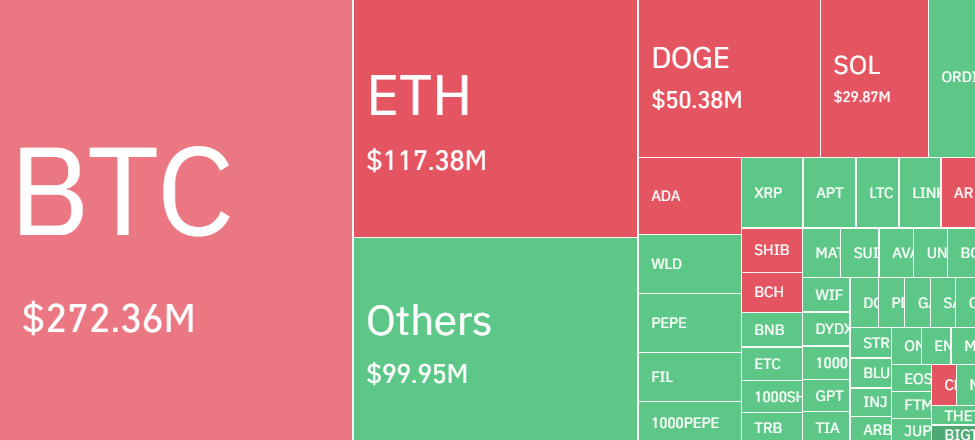
In the past 24 hours, the cryptocurrency market has seen a significant uptick in liquidations, with figures from Coinglass indicating that total liquidations exceeded $750 million. Remarkably, within a mere hour, the Ethereum market experienced the elimination of nearly $1.5 million in long positions as sellers defended the $3500 mark. However, Ethereum saw a total liquidation of nearly $120 million in the last 24 hours and sellers liquidated around $70 million worth of positions.

Between February 26 and February 28, the price of Ether rose by 15%, hitting its highest point in nearly two years at $3,500. However, this upward trend was accompanied by an increase in the cost of bullish leverage positions, raising concerns. Additionally, with Ether briefly dropping to $3,219, there’s a belief among some investors that overly optimistic sentiment, fueled by the fear of missing out (FOMO), has increased the potential for widespread liquidations.

To assess if the recent surge in Ether’s price to $3,500 was fueled by excessive leverage, an analysis of the ETH derivatives market is essential. Perpetual contracts, or inverse swaps, have an inbuilt rate adjusted every eight hours. A positive funding rate suggests a higher demand for leverage from long positions, whereas a negative rate indicates more leverage by short positions.
The volatility near $3,500 led to $102 million in ETH liquidations, $66 million of which were long positions. This also amplified leverage for existing bullish positions as Ether’s price drop to $3,200 reduced their margin. Currently, Ether’s funding rate of 0.067%—or 5.6% monthly—is significantly above the norm of the past weeks, hinting at potential unsustainability if it persists for an extended period.

Moreover, a rising number of short-term holders are choosing to leave the market as prices hover near the peak range of $3,300-$3,500, thereby exerting downward pressure on the price. Data from IntoTheBlock shows that the Netflow metric has risen above the signal line and is now in the positive territory. This indicates that the volume of ETH coming into exchanges now exceeds the volume leaving, resulting in an increase in exchange reserves. Such a trend could increase the likelihood of selling pressure, potentially causing the ETH price to undergo another correction. The Netflow metric currently stands at 19.2K ETH.
What’s Next For ETH Price?
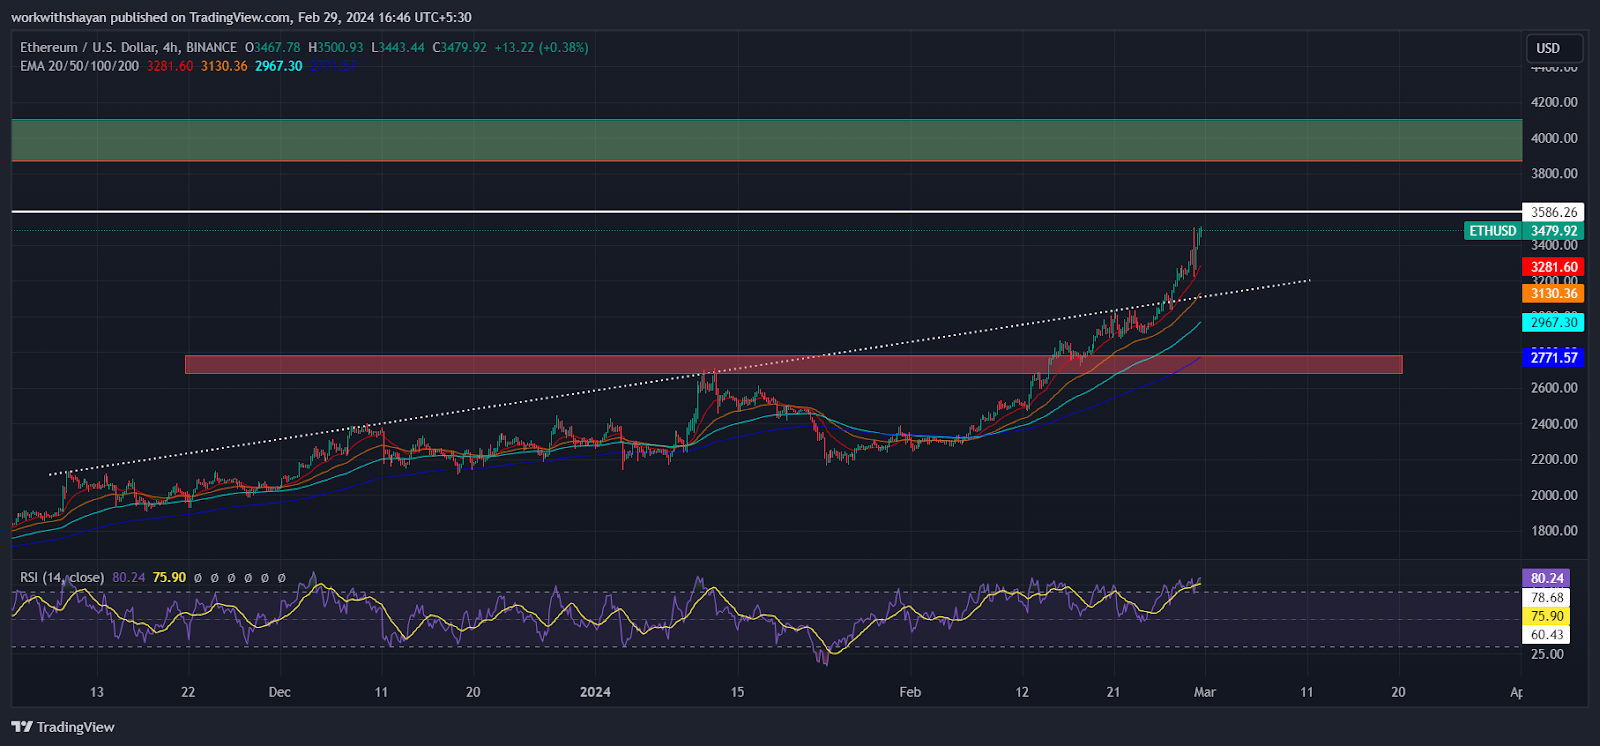
Recently, Ether encountered resistance at $3,500 and is now looking to adjust its price in the upcoming hours, indicating that sellers are active at higher prices. However, buyers continue to show strength near that level. Currently, the ETH price is at $3,472, showing a rise of over 4% from yesterday’s price.

On the positive side, the price has remained above the 20-day Exponential Moving Average (EMA) of $3,281 despite bearish pullback, offering a glimmer of hope. Yet, there is a possibility of increased selling pressure if the price doesn’t surpass the $3,500 level soon.
If the price falls below the 20-day EMA, we could see a decline towards the ascending support line at $3,000.
On the other hand, if there is a successful move and closure above the resistance level, it would indicate that the bullish momentum is still alive. In such a case, buyers might try to send the price above the range of $3,600 -$4,100, targeting an upward trend towards new ATH. However, the overbought RSI level might trigger a short-term correction.


