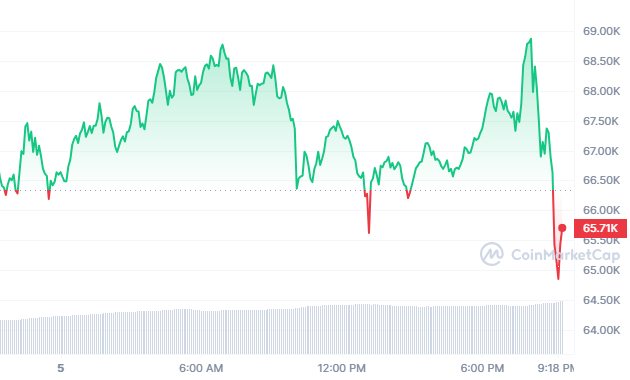
In a surprising turn of events, *BTC* reached a new all-time high, soaring to $69,000. However, the celebration was short-lived as the cryptocurrency experienced a downturn shortly after, with the price dropping to $65,737, marking a 0.83% decline over the last 24 hours.
This recent fluctuation in Bitcoin’s price has caught the attention of investors and traders alike. The dip, occurring right after reaching an all-time high, has prompted market analysts to scrutinize the factors contributing to this sudden change.

Sell-off Coming?
Prominent among the speculative causes is a recent tweet from renowned crypto analyst Ali Martinez, who pointed out a significant pattern on the Bitcoin daily chart. According to Martinez, the TD Sequential indicator, known for its reliability in predicting Bitcoin trends since the beginning of the year, flashed a sell signal.
This indicator has a notable track record; it signaled a buy in early January, which was followed by a substantial 34% surge in Bitcoin’s price. Similarly, a sell signal issued in mid-February preceded a 4.44% decrease in its value.
The TD Sequential indicator is a technical analysis tool that is often used to identify the timing of market trends’ exhaustion and potential reversal points. Its recent sell signal is therefore seen by many in the crypto community as a cautionary indicator, warranting close attention from investors.
This isn’t the first time Bitcoin has experienced volatility. The cryptocurrency is known for its rapid price changes, which can be influenced by various factors, including market sentiment, regulatory news, and macroeconomic trends. However, the latest dip following an all-time high has sparked a renewed analysis of market conditions and the factors driving Bitcoin’s price movements.


