

- 1. Key Takeaways
- 2. Table of Contents
- 3. What Is Technical Analysis for Crypto, Exactly?
- 4. Which Chart Types and Timeframes Work Best for Crypto?
- 5. Which Indicators Actually Matter for Crypto Trading?
- 6. How Do Support, Resistance, and Chart Patterns Work in Crypto?
- 7. Bitcoin Technical Analysis Example: What the Chart Showed on November 3, 2026
- 8. How Should You Size Positions and Set Stops in Crypto?
- 9. What Are the Best Tools for Crypto Chart Analysis?
- 10. How Do You Set Up a Crypto Trade Step by Step?
- 11. What Mistakes Wreck Most Crypto TA Setups?
- 12. What Does Order Book and Depth Analysis Tell You?
- 13. What Crypto Data Do Traders Combine With Charts?
- 14. How Do Sentiment and News Move Technical Patterns?
- 15. What Are the Real Limits of Technical Analysis in Crypto?
- 16. How I Apply Confluence When Reading Crypto Charts
- 17. Follow Live Crypto Analysis From Blockchainreporter
- 18. Frequently Asked Questions About Technical Analysis Crypto
- 19. Sources
- 20. Recommended
Last Updated: November 3, 2026
Crypto technical analysis is the study of a cryptocurrency’s price, volume and order flow on charts to judge trend, momentum and likely reaction zones, so traders can plan when to enter, where to place a stop and when to exit. It can organize risk and show where buyers and sellers have acted before, but it cannot predict prices with certainty, judge whether a project has real value, or protect against hacks, delistings and sudden news.
In practice, crypto technical analysis combines classic chart tools such as moving averages, RSI, MACD, Bollinger Bands, volume, support and resistance and Fibonacci levels with crypto-specific data: perpetual futures funding rates, open interest, spot bitcoin ETF flows and sentiment gauges like the Crypto Fear and Greed Index, which stood at 26 (Fear) on November 3, 2026.
Before opening a chart, run this checklist:
- Structure: Is price above or below the last major swing high and swing low?
- Momentum: Do RSI and MACD agree with the trend direction?
- Confirmation: Is volume, derivatives data or ETF flow backing the move?
- Risk: Do you know your stop and position size before entry?
Key Takeaways
Crypto technical analysis works best when price structure, indicator confluence, and volume or derivatives confirmation all point the same direction before any capital is at risk.
| Point | Details |
|---|---|
| Know what it can and cannot do | Technical analysis frames probabilities and risk; it does not forecast prices or measure a project’s fundamentals. |
| Use zones, not lines | Draw support and resistance as bands from clustered highs and lows, then check them against volume. |
| Limit your indicator count | Combine 3 to 4 tools that measure different things: trend, momentum, volatility and volume. |
| Confirm every breakout | Look for rising volume, and check funding rates and open interest before trusting a breakout or retest. |
| Size risk before entry | Many traders cap risk at 1% to 2% of the account per trade and place stops at structure or ATR distance, not fixed percentages. |
| Track live analysis | Blockchainreporter publishes daily price data and market coverage that you can use to cross-check your own chart reads. |
Table of Contents
- What Is Technical Analysis for Crypto, Exactly?
- Which Chart Types and Timeframes Work Best for Crypto?
- Which Indicators Actually Matter for Crypto Trading?
- How Do Support, Resistance, and Chart Patterns Work in Crypto?
- Bitcoin Technical Analysis Example: What the Chart Showed on November 3, 2026
- How Should You Size Positions and Set Stops in Crypto?
- What Are the Best Tools for Crypto Chart Analysis?
- How Do You Set Up a Crypto Trade Step by Step?
- What Mistakes Wreck Most Crypto TA Setups?
- What Does Order Book and Depth Analysis Tell You?
- What Crypto Data Do Traders Combine With Charts?
- How Do Sentiment and News Move Technical Patterns?
- What Are the Real Limits of Technical Analysis in Crypto?
- How I Apply Confluence When Reading Crypto Charts
- Follow Live Crypto Analysis From Blockchainreporter
- Frequently Asked Questions About Technical Analysis Crypto
- Sources
What Is Technical Analysis for Crypto, Exactly?
Technical analysis for crypto is the practice of reading price and volume history on a chart to judge the current trend, how strong it is, and where price has reacted before. Fundamental analysis asks a different question: whether a project’s technology, adoption, token supply and revenue justify its value. The two are complements, not rivals. Fundamentals help decide what to own; technical analysis helps decide when to act and how much to risk.
What technical analysis can do:
- Show the trend and its strength on any timeframe.
- Mark zones where buyers or sellers have repeatedly stepped in.
- Give a rule-based place for a stop, so a losing idea is cut at a planned point.
- Make a trading process repeatable and testable on historical data.
What technical analysis cannot do:
- Predict a price with certainty. Every signal is a probability, and signals fail often.
- Tell you whether a token has lasting value or a working product.
- Anticipate hacks, exchange outages, regulatory actions or delistings.
- Replace risk management. A correct chart read with an oversized position can still wipe out an account.
Crypto markets also behave differently from stocks. They trade 24 hours a day, seven days a week, with no closing bell. Liquidity is split across many exchanges instead of one primary venue. Leverage on perpetual futures can trigger forced liquidations that push price through a level that would hold on a stock chart. That combination makes daily and weekly closes, multi-timeframe checks and derivatives data carry more weight than they do for an equity trader.
- No session close means price gaps are rare on crypto charts, while weekend moves on thin liquidity are common.
- Fragmented order books mean the same support level can look solid on one exchange and thin on another.
- Cascading liquidations can produce long wicks that break textbook indicator rules.
Which Chart Types and Timeframes Work Best for Crypto?
Candlestick charts remain the default because each candle shows the open, high, low and close for its period at a glance. Heikin Ashi candles average price data to smooth noise for trend-following styles, and range bars ignore time entirely, plotting a new bar only after price moves a set amount, which some scalpers prefer during choppy sessions.
- Candlesticks: the all-purpose choice for every style.
- Heikin Ashi: useful for filtering chop and staying with a trend.
- Range bars: a niche tool for pure price-action scalping.
| Trading Style | Typical Timeframe |
|---|---|
| Scalping | 1 minute to 15 minutes |
| Swing trading | 1 hour to 4 hours, checked against the daily |
| Position trading | Daily to weekly |
Because crypto never closes, each platform picks a time for the daily candle; CoinMarketCap and many exchange charts use 00:00 UTC. Use the same time zone on every chart you compare, or your daily closes will not match.
Pro Tip: Check the 4 hour and daily charts together before entering. If they disagree on direction, treat any lower timeframe signal as noise until they line up.
Which Indicators Actually Matter for Crypto Trading?
Indicators fall into four functions, and mixing all four beats stacking five versions of the same thing. Trend tools such as the 50-day and 200-day moving averages show direction. Momentum tools such as RSI and MACD show whether that direction is gaining or losing strength. Volatility tools such as Bollinger Bands and ATR show how much room price needs. Volume tools such as OBV and volume profile show whether real participation backs the move.
| Indicator | What it measures | Standard settings | How crypto traders read it |
|---|---|---|---|
| Moving averages (SMA, EMA) | Trend direction | 20, 50 and 200 periods | Price above a rising 200-day average is read as a long-term uptrend; a 50/200 cross is called a golden cross (up) or death cross (down). |
| RSI | Momentum, 0 to 100 | 14 periods; 70 overbought, 30 oversold | Some traders widen the bands to 80/20 in strong crypto trends; divergence with price is watched closely. |
| MACD | Momentum and trend shifts | 12, 26, 9 | MACD line crossing the signal line, and the histogram turning, flag a change in momentum. |
| Bollinger Bands | Volatility | 20-period SMA, 2 standard deviations | Narrow bands (a squeeze) mark low volatility; closes outside the bands mark stretched moves. |
| ATR | Average range per candle | 14 periods | Used to set stop distance and position size. |
| Volume and OBV | Participation | Raw volume; OBV running total | Breakouts on rising volume are trusted more than breakouts on flat volume. |
What Are Moving Averages?
A moving average smooths price by averaging closes over a set number of periods. A simple moving average (SMA) weights each close equally; an exponential moving average (EMA) gives more weight to recent closes, so it reacts faster. The 50-day and 200-day averages are the most widely watched on bitcoin’s daily chart.
What Is RSI?
The Relative Strength Index, developed by J. Welles Wilder and introduced in his 1978 book New Concepts in Technical Trading Systems, compares the size of recent gains with recent losses on a scale from 0 to 100. The standard setting is 14 periods, with readings above 70 called overbought and below 30 oversold. In strong crypto trends, RSI can stay above 70 or below 30 for weeks, which is why it works better as a momentum gauge than as a reversal signal.
Trend-following tools work differently; see our explainer on the Parabolic SAR indicator.
What Is MACD?
The Moving Average Convergence Divergence indicator, developed by Gerald Appel in the late 1970s, subtracts the 26-period EMA from the 12-period EMA. A 9-period EMA of that line is the signal line, and the histogram is the gap between them. A cross above the signal line shows improving momentum; a cross below shows fading momentum.
What Are Bollinger Bands?
Bollinger Bands, created by John Bollinger, place bands two standard deviations above and below a 20-period simple moving average. The bands widen when volatility rises and narrow when it falls. A tight squeeze often comes before a large move, but the squeeze itself does not show the direction.
Why Does Volume Matter?
Volume shows how much was traded in each candle. On-Balance Volume, introduced by Joe Granville in 1963, keeps a running total that adds a period’s volume on up closes and subtracts it on down closes. Rising OBV alongside rising price suggests broad participation. In crypto, volume is reported separately by every exchange, so aggregated sources such as CoinMarketCap give a wider view than a single venue’s chart.
Most indicators are lagging, meaning they confirm what already happened rather than predicting what comes next. Piling on six or seven of them multiplies conflicting signals instead of adding clarity.
Two example setups:
- Swing setup: 50 and 200-day moving averages for trend, RSI for momentum, OBV for volume confirmation. Act only when all three agree on direction.
- Breakout setup: Bollinger Band squeeze for volatility compression, MACD cross as the trigger, volume spike as confirmation. Skip the trade if volume stays flat on the breakout candle.
Pro Tip: Crypto’s wider daily swings mean standard RSI thresholds of 30 and 70 often trigger too early. Some traders widen them to 20 and 80 during strong trending moves.
How Do Support, Resistance, and Chart Patterns Work in Crypto?
Support is a price zone where buying has repeatedly stopped a decline; resistance is a zone where selling has repeatedly stopped a rise. Draw zones, not lines. A band built from clustered wicks and candle bodies reflects how price actually reacts far better than a single thin line, especially once you check it against the volume traded at those prices.
Classic patterns still show up constantly: ascending and descending triangles before breakouts, head-and-shoulders tops, double tops and bottoms at range extremes, and bull or bear flags during trend pauses. The mechanics do not change from stocks to crypto. What changes is the need for confirmation.
When a support zone breaks on strong volume, it frequently flips into resistance on the retest, a role-reversal pattern that underpins most breakout-and-retest strategies. A false break, by contrast, often shows weak volume and gets reclaimed within a few candles.
Bitcoin’s $63,000 zone is a recent example of a range traders watched. From August 1 to August 18, 2026, bitcoin traded between a daily low of about $62,230 and a high of about $65,400 on CoinMarketCap data, then broke out between August 19 and August 21, closing at about $78,335 on August 21 as daily volume rose from roughly $10 billion to $26 billion a day earlier in the month to about $74.5 billion on August 21. Beyond the chart, liquidation heatmaps and perpetual futures order books can show where leveraged positions cluster around such levels.
How Do Fibonacci Retracements Work?
Fibonacci retracement levels divide a completed price swing into ratios, most commonly 23.6%, 38.2%, 50% and 61.8%, to mark where a pullback has historically tended to pause. Traders measure from a swing low to a swing high in an uptrend (or high to low in a downtrend) and watch how price behaves at each level. The 50% level is not a Fibonacci ratio; it comes from Dow Theory’s observation that markets often retrace about half of a prior move. Fibonacci levels are reference zones to check against other evidence, not price targets.
Pro Tip: Never trust a retest without checking volume or open interest. A retest on shrinking volume is more likely to fail than one backed by fresh participation.
Bitcoin Technical Analysis Example: What the Chart Showed on November 3, 2026
This worked example applies the tools above to bitcoin’s daily chart using observed data only. It describes where price was and what the indicators read; it does not predict where bitcoin goes next and it is not a trade recommendation. Price data comes from CoinMarketCap; indicator values are Blockchainreporter’s calculation from CoinMarketCap daily closes through November 2, 2026, using the standard settings in the table above.
Price. Bitcoin traded at about $77,298 at 12:41 UTC on November 3, 2026, down 0.5% over 24 hours, 3.5% over seven days and 9.3% over 30 days. The 24-hour range was about $76,270 to $78,106. Market capitalization was about $1.55 trillion, and bitcoin dominance was about 59.9%. The all-time high remains $126,198, set on October 6, 2025, so price stood about 38.7% below that peak.
Structure. The 2026 low on CoinMarketCap daily data is about $57,748, set on July 1, 2026. The most recent major swing high is about $87,364 on September 21, 2026, and price came back within about $220 of it on October 2 (about $87,146). Since then, the daily chart shows lower highs, and the swing lows sit at about $74,945 (September 15) and about $76,190 (October 30, the day after the Binance hack). Observed zones: a resistance band near $86,970 to $87,360 and a support band near $74,900 to $76,300.
| Observed reading (daily chart) | Value | Date |
|---|---|---|
| Price (CoinMarketCap) | about $77,298 | Nov 3, 2026, 12:41 UTC |
| 2026 low | about $57,748 | Jul 1, 2026 |
| 90-day high | about $87,364 | Sep 21, 2026 |
| Most recent swing low | about $76,190 | Oct 30, 2026 |
| 50-day SMA | about $81,913 | Nov 2 close |
| 200-day SMA | about $73,157 | Nov 2 close |
| RSI (14) | 35.0 | Nov 2 close |
| MACD (12, 26, 9) | MACD -1,266, signal -787 | Nov 2 close |
| Bollinger Bands (20, 2) | upper $84,442, middle $80,501, lower $76,560 | Nov 2 close |
| ATR (14) | about $1,958 (about 2.6% of price) | Nov 2 close |
Trend. The November 2 close of about $76,677 sat below the 50-day average and above the 200-day average. The 50-day average had crossed above the 200-day on September 8, 2026, a golden cross in chart terms, and that cross was still in place, but price had moved back under the shorter average.
Momentum. RSI at 35.0 was below the 50 midpoint and above the 30 oversold line. MACD was negative and below its signal line, so momentum read as weak.
Volatility. The close sat just above the lower Bollinger Band, and the bands were about 9.8% wide relative to the middle band. ATR showed an average daily range of close to $2,000, a figure traders use to size stops.
Fibonacci. Measured from the July 1 low to the September 21 high, the 23.6% retracement sits near $80,375, the 38.2% near $76,051, the 50% near $72,556 and the 61.8% near $69,061. Price on November 3 was between the 23.6% and 38.2% levels.
Context beyond the chart. On the same day, the Crypto Fear and Greed Index read 26 (Fear), US spot bitcoin ETFs had recorded net outflows on the two previous trading days, and Binance’s BTCUSDT perpetual funding rate sat at the 0.01% baseline. The next section explains those readings. For the day’s market news, see Blockchainreporter’s Bitcoin news today hub.
What the example shows is how the pieces fit together: zones from structure, trend from moving averages, momentum from RSI and MACD, room to move from ATR and Bollinger Bands, and a check against derivatives, flows and sentiment. It does not show what happens next.
How Should You Size Positions and Set Stops in Crypto?
Stop placement tied to structure or ATR beats an arbitrary fixed percentage. Place stops beyond the actual invalidation point of a setup, whether that is a recent swing low or a multiple of ATR, not at a round number that ignores what the chart shows. Blockchainreporter’s stop-loss guide for crypto explains order types and placement in detail.
- Risk a fixed percentage of the account per trade, not a fixed dollar amount.
- Use ATR-based or structural stops instead of arbitrary percentages.
- Calculate size from the stop distance: position size equals the amount at risk divided by the distance to the stop.
- Reduce size, not just leverage, when volatility spikes.
Leverage multiplies both gains and liquidation risk, and low realized volatility does not mean low risk when funding rates and open interest are stretched. Rising open interest paired with a crowded funding rate is a classic setup for a sharp liquidation cascade in either direction. Treat it as a warning signal, not background noise.
What Are the Best Tools for Crypto Chart Analysis?
Effective crypto technical analysis needs a charting platform with interactive indicators, plus access to volume, order-book depth and derivatives data. These are widely used, named factually rather than ranked:
- TradingView: a browser and app charting platform with crypto data from many exchanges and a large indicator library. Its pricing page on November 3, 2026 listed a free Basic plan with 2 indicators per chart and paid Essential, Plus, Premium and Ultimate plans allowing 5, 10, 25 and 50 indicators per chart.
- Exchange charts: large exchanges such as Binance, Coinbase (Coinbase Advanced) and Kraken (Kraken Pro) include candlestick charts, built-in indicators and order book depth charts on their trading screens, showing that venue’s own liquidity.
- Market data aggregators: CoinMarketCap and CoinGecko show price and volume aggregated across many exchanges, useful for checking whether a move on one venue is market-wide.
- Derivatives and flow data: exchange futures pages and analytics dashboards such as CoinGlass show funding rates, open interest and liquidations; Farside Investors publishes daily flows for US spot bitcoin ETFs.
- Sentiment: the Crypto Fear and Greed Index from alternative.me publishes a daily 0 to 100 reading.
Practice on a demo or paper account before committing real funds. Running the same setup many times on paper reveals whether your rules hold up before a single dollar is at stake.
How Do You Set Up a Crypto Trade Step by Step?
- Identify market structure. Decide whether price is trending, ranging or reversing on your chosen timeframe.
- Mark zones and levels. Draw support and resistance zones from clustered highs and lows, not single wicks.
- Confirm with indicators. Check that trend, momentum and volume line up before acting.
- Check the crypto context. Look at funding rates, open interest, ETF flows and the news calendar.
- Define entry, stop and exit plan. Set all three before placing the order, not after.
- Size the position. Calculate size from your risk percentage and stop distance.
- Record the trade. Log the entry logic, outcome and what you would change.
A simple illustration: price returns to a support zone on the daily chart, RSI shows bullish divergence, and volume rises on the bounce. A trader following these steps would define the invalidation point below the recent swing low, size the position so a stop there loses only the planned amount, and log the trade either way. The steps describe a process, not a signal to buy any asset.
What Mistakes Wreck Most Crypto TA Setups?
Indicator stacking is the most common trap. Running RSI, Stochastic and CCI at once triples the noise, since all three measure similar momentum. Drawing support lines after price already bounced (hindsight bias) and ignoring exchange fees or slippage on tight setups are close behind.
- Too many indicators measuring the same thing.
- Drawing zones with hindsight instead of a declared rule.
- Ignoring fees, slippage and funding costs on leveraged or high-frequency setups.
- Trading a breakout on one exchange’s chart without checking aggregated volume.
- Treating an oversold RSI reading as a buy signal in a strong downtrend.
- Using leverage so high that normal volatility, roughly one ATR, can trigger liquidation.
- Ignoring scheduled events such as US inflation data or Federal Reserve decisions.
Confirm every signal with volume, multi-timeframe agreement and order-book context before entering.
Pro Tip: Backtest a small, fixed rule set on historical data before trading it live, and resist the urge to tweak parameters mid-test. Changing rules after seeing results is how traders fool themselves into thinking a strategy works.
What Does Order Book and Depth Analysis Tell You?
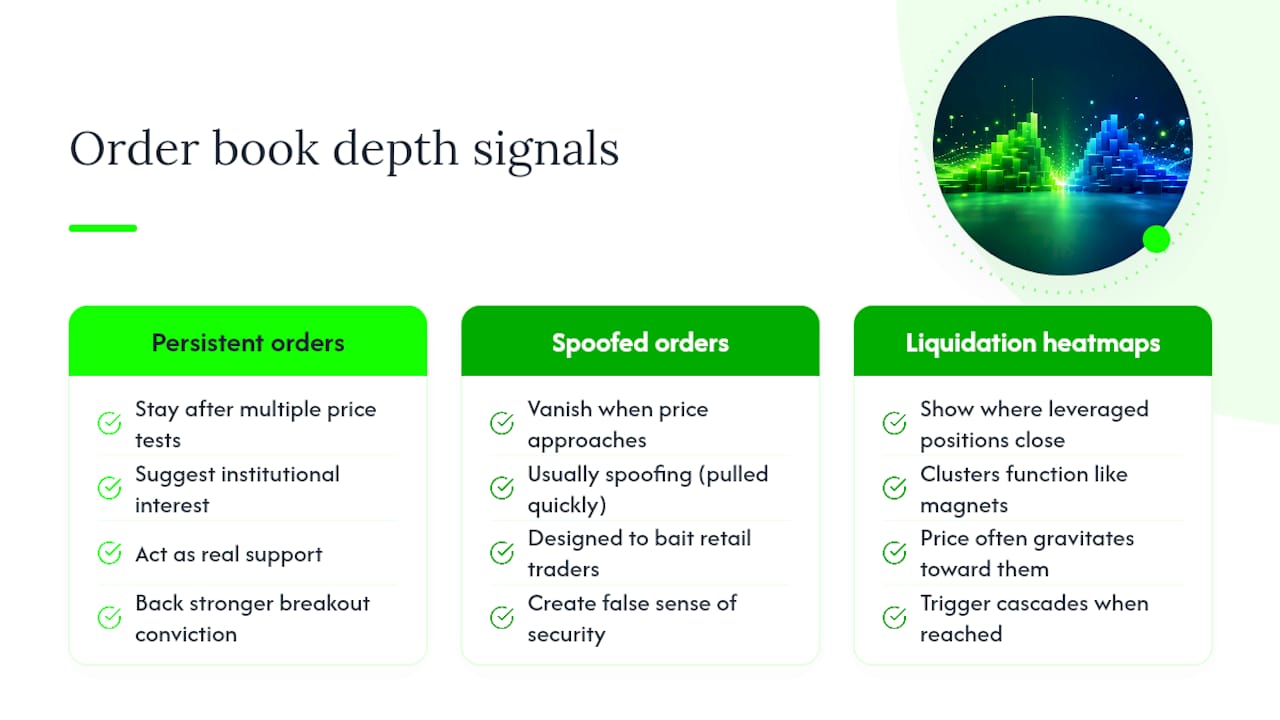
The order book lists every resting buy order (bids) and sell order (asks) at each price level, and a depth chart plots their cumulative size, so you can see how much would need to trade to move price by a given amount. Thick depth near the current price means larger orders can trade with less slippage; thin depth means price can move quickly on modest volume. Because each exchange has its own book, depth differs from venue to venue.
A large cluster of bids just below the current price can act as real support, but only if those orders are genuine. Orders that are placed and then pulled as price approaches can be spoofing, a manipulative practice that US law prohibits in regulated futures markets. Orders that stay in place across several tests of a level are more likely to be genuine.
Liquidation heatmaps add another layer, estimating where leveraged positions would be forcibly closed if price reaches certain levels. Price often trades toward zones with heavy estimated liquidation density, and when it does, forced orders can accelerate the move. These maps are model estimates built from public futures data, not exact counts.
Reading depth alongside your indicator setup changes how you interpret a breakout. A breakout through resistance that eats through a thin book carries less conviction than one grinding through thick, persistent resting orders. Depth analysis will not replace chart work, but it tells you whether the level you are watching is backed by real liquidity.
What Crypto Data Do Traders Combine With Charts?
Crypto traders combine charts with four data sets that do not exist for most stocks: perpetual futures funding rates, open interest, spot ETF flows and sentiment indexes. Each one adds context to a chart signal; none of them is a signal on its own.
| Data | What it shows | Reading on November 3, 2026 |
|---|---|---|
| Funding rate | Periodic payment between longs and shorts on perpetual futures | Binance BTCUSDT: last settled rate 0.0100% per 8 hours (read 12:40 UTC) |
| Open interest | Total value of open futures contracts | Binance BTCUSDT perpetual: about 100,011 BTC, roughly $7.7 billion (12:40 UTC) |
| Spot bitcoin ETF flows | Net money into or out of US spot bitcoin ETFs | Net outflows of $643.2 million on Oct 30 and $398.6 million on Nov 2 (Farside Investors) |
| Fear and Greed Index | Composite sentiment score from 0 to 100 | 26, Fear (37 on Nov 2, 34 on Nov 1) |
Funding rates. Perpetual futures have no expiry, so exchanges use funding payments to keep their price close to spot. According to Binance’s funding rate guide, funding on its USDT-margined contracts is settled every 8 hours by default (00:00, 08:00 and 16:00 UTC), with a fixed interest component of 0.01% per interval. When funding is positive, longs pay shorts; when it is negative, shorts pay longs. Persistently high positive funding means leveraged longs are crowded; deeply negative funding means shorts are crowded. The November 3 reading sat at the 0.01% baseline, which does not point to crowding on either side.
Open interest. Open interest counts contracts that are still open. Price rising with rising open interest means new leveraged positions are backing the move; price rising while open interest falls often reflects shorts closing. Sharp drops in open interest during a fast move usually signal liquidations.
ETF flows. Since US spot bitcoin ETFs launched in January 2024, their daily net creations and redemptions have become a widely watched measure of institutional demand. Farside Investors’ data showed net outflows of $643.2 million on October 30, 2026 and $398.6 million on November 2, 2026, with BlackRock’s IBIT accounting for $405.3 million of outflows on November 2.
Sentiment. The Crypto Fear and Greed Index from alternative.me combines measures such as volatility, momentum and social data into one daily score. It read 26 (Fear) on November 3, 2026. Some traders treat extreme readings as contrarian context, but the index describes mood, not direction.
How Do Sentiment and News Move Technical Patterns?
News and sentiment do not override technical structure so much as they accelerate or invalidate it within minutes. A clean ascending triangle can break on schedule, or it can be blown apart by a headline that has nothing to do with the chart.
The Binance hack is a recent example. On October 29, 2026, the day the exchange was hacked for about $6.3 billion (as widely reported; the FBI attributed it to North Korea’s TraderTraitor group on October 31, CoinDesk reported), bitcoin opened near $81,268 and closed near $77,775 on CoinMarketCap data, on about $40.9 billion of volume, well above the 30-day average of about $25.9 billion a day. The next day it set the swing low of about $76,190. The chart pattern did not fail; the news changed who was willing to defend the level.
Macro data releases carry similar weight. CPI prints still move Bitcoin and altcoins hard enough to invalidate a setup that looked sound the day before. The same goes for large liquidity events, such as traders watching Bitcoin hold above $64,000 around a major share unlock, when a single headline shifted positioning across the market. Before acting on a headline, check it against primary sources; Blockchainreporter’s guide on how to verify crypto news and rumors covers the steps.
The practical takeaway: check the news calendar before trusting a pattern near a major economic release, and widen your stop or stay out if a headline-heavy event sits directly in your trade’s path.
What Are the Real Limits of Technical Analysis in Crypto?
Technical analysis describes probability, not certainty, and crypto’s structural quirks widen that gap compared with traditional markets. Thin liquidity on small-cap tokens means a single large order can invalidate a pattern that would hold in a deeper market. What looks like a clean breakout on a token with a $50 million market cap might just be one wallet moving size.
Fragmented liquidity means the same asset can show conflicting signals depending on which venue’s data feeds the chart. A support zone that holds on one exchange might already be broken on another, and retail charting tools do not always reconcile that difference.
Leverage compounds the problem. Cascading liquidations can produce wicks that violate every rule in the playbook, not because the analysis was wrong, but because forced selling ignores chart structure. Most tokens also lack the earnings reports and regulated disclosure calendars that anchor stock prices, so sentiment and speculation carry more weight.
Technical analysis also cannot see exchange-specific risks. A chart did not warn of the October 29, 2026 Binance hack, and no indicator measures custody risk, smart contract risk or a token’s unlock schedule.
None of this makes technical analysis useless. It means treating every setup as a probability estimate that improves with confirmation, rather than a mechanical formula guaranteed to work.
How I Apply Confluence When Reading Crypto Charts
My rule is simple: cap it at four indicators, and never act without volume or derivatives data backing the signal. A perfect-looking triangle breakout with no volume behind it gets ignored. Start the same way. Pick three tools that measure different things, write down your entry and exit rules before you look at the chart, and let the market confirm the idea instead of talking yourself into a trade.
Follow Live Crypto Analysis From Blockchainreporter
Reading charts is only half the job. You also need to know what is moving the market in real time. Blockchainreporter tracks live price action alongside the news and macro events that move crypto technical patterns, from ETF flow swings to exchange incidents, so you are not analyzing a chart in a vacuum.
For daily context, follow the Bitcoin news today hub and the crypto market today page, and use the market analysis homepage for regular price updates as new setups develop.
Frequently Asked Questions About Technical Analysis Crypto
What is crypto technical analysis?
Crypto technical analysis is the study of a cryptocurrency’s price, volume and order flow on charts to judge trend, momentum and reaction zones. Traders use it to plan entries, stops and exits with tools such as moving averages, RSI, MACD, Bollinger Bands, support and resistance, and Fibonacci levels. It describes probabilities based on past market behavior and does not predict future prices with certainty.
Is technical analysis reliable for crypto trading?
Technical analysis can improve consistency when signals are confirmed by volume, several timeframes and derivatives data, but no method is reliable in every market. Crypto adds round-the-clock trading, fragmented liquidity and leveraged liquidations that can break clean patterns quickly. Treat each setup as a probability, size positions so a failed signal costs only a planned amount, and expect a meaningful share of signals to fail.
What is the best timeframe for crypto technical analysis?
It depends on the trading style. Scalpers usually work on 1 to 15 minute charts, swing traders favor 1 hour to 4 hour charts checked against the daily, and position traders rely on daily and weekly closes. Higher timeframes produce fewer false signals. Because crypto trades nonstop, many platforms close the daily candle at 00:00 UTC, so compare charts set to the same time zone.
Which indicators are best for crypto technical analysis?
There is no single best indicator. Most crypto traders combine one tool from each function: a trend tool such as the 50-day and 200-day moving averages, a momentum tool such as RSI or MACD, a volatility tool such as Bollinger Bands or ATR, and a volume tool such as OBV. Three or four non-overlapping indicators usually give clearer signals than stacking several tools that measure the same thing.
What do RSI and MACD tell you about a crypto chart?
RSI compares recent gains with recent losses on a 0 to 100 scale, with 70 and above called overbought and 30 and below oversold on the standard 14-period setting. MACD subtracts the 26-period exponential moving average from the 12-period one and compares it with a 9-period signal line. Both measure momentum, so using them together mainly confirms each other rather than adding new information.
How do Fibonacci retracements work in crypto?
Fibonacci retracements divide a completed price swing into the ratios 23.6%, 38.2% and 61.8%, plus a 50% level taken from Dow Theory, to mark where pullbacks have often paused. A trader measures from a swing low to a swing high, then watches how price reacts at each level. The levels work as reference zones to check against volume and structure, not as price targets.
Do chart patterns actually work in crypto?
The same patterns found on stock charts, including triangles, head-and-shoulders, double tops and bottoms, and flags, appear regularly on crypto charts. Their follow-through is less dependable on thinly traded tokens, where one large order can create a false breakout. Confirmation matters more in crypto: rising volume on the breakout, agreement across timeframes, and stable funding rates and open interest.
How do funding rates and open interest help technical analysis?
Funding rates show whether leveraged longs or shorts are paying to hold perpetual futures positions, which reveals crowding. On Binance, funding settles every 8 hours by default. Open interest measures how many futures contracts remain open. Price moving with rising open interest means fresh leverage is involved, which raises the chance of a sharp liquidation move if price reverses against crowded positions.
Can news override a technical setup?
Frequently. A clean chart pattern can break down within minutes when a major headline, exchange incident or macro data release changes sentiment. On October 29, 2026, the day Binance was hacked for about $6.3 billion, bitcoin fell from about $81,268 to $77,775 on heavy volume. Checking the news calendar and keeping stops in place reduces exposure to these events.
Can technical analysis predict crypto prices?
No. Technical analysis cannot predict a specific price or date. It identifies trend, momentum and zones where buyers and sellers acted before, which helps traders plan risk. It cannot measure a project’s fundamentals or foresee hacks, regulatory actions or delistings. Published price forecasts are opinions from their authors, and any single chart signal can fail regardless of how clean it looks.
This article is general information, not investment advice or a substitute for advice from a qualified financial advisor. Crypto assets are volatile and you can lose money. Consult a qualified financial professional about your own circumstances before acting on anything here.
Sources
- Bitcoin price, market capitalization, dominance and daily OHLCV history: CoinMarketCap, read November 3, 2026, 12:41 UTC.
- Crypto Fear and Greed Index: alternative.me, read November 3, 2026.
- Funding rate mechanics: Binance funding rate guide; BTCUSDT funding and open interest from Binance’s public futures API, November 3, 2026, 12:40 UTC.
- US spot bitcoin ETF flows: Farside Investors, read November 3, 2026.
- TradingView plans and indicator limits: TradingView pricing, read November 3, 2026.
- Indicator definitions (RSI, MACD, Bollinger Bands, OBV, Fibonacci retracements): StockCharts ChartSchool.
- Indicator values in the Bitcoin example: Blockchainreporter’s calculation from CoinMarketCap daily closes through November 2, 2026.
Recommended