In a captivating series of tweets, the prominent crypto analyst known as Blockchain Backer has shaken the foundations of a widely accepted theory in the cryptocurrency world. He has challenged the notion that Bitcoin’s (BTC) price movements are intrinsically tied to its 4-year block reward halving cycles. The analyst introduced a groundbreaking perspective that suggests Bitcoin’s price trajectory is more closely correlated with the Dow Jones Industrial Average (DJI) and its all-time highs.
The Bitcoin Halving and Its Alleged Impact
Bitcoin, the world’s leading cryptocurrency by market cap, experiences a block reward halving roughly every four years. This fundamental event reduces the reward miners receive for validating transactions by half, leading some to theorize that it curtails inflationary pressures on the *BTC* price. The underlying logic is intuitive: with miners receiving fewer Bitcoins, they would ostensibly sell less, thereby reducing sell pressure and potentially setting the stage for price appreciation.
Historically, the Bitcoin block reward halvings have occurred on May 11, 2020, July 9, 2016, and November 12, 2012. After each halving event, the time taken for Bitcoin to reach its all-time high has displayed an increasing trend: 92 days in 2012, 180 days in 2016, and 204 days in 2020. This escalating time frame has sown seeds of doubt regarding the reliability and predictability of the 4-year cycle theory.
The Dow Jones Connection: A New Perspective Emerges
Fuelled by skepticism, Blockchain Backer delved deeper to explore potential correlations between BTC’s price movements and the DJI, a prominent benchmark index representing a cross-section of thirty large publicly-owned companies trading in the United States. His findings unveiled a compelling pattern. In 2012, Bitcoin’s all-time high was achieved 92 days after its halving, coincidentally just 15 days before the DJI marked its new peak following the Great Financial Crisis.
Moving on to 2016, BTC hit its all-time high 180 days post-halving, closely mirroring DJI’s breakout into a new all-time high by a span of 57 days. Similarly, in 2020, the Bitcoin price reached its all-time pinnacle 204 days after the halving, only 14 days after DJI set its latest record. These synchronicities suggest a stronger correlation between Bitcoin’s bull runs and major DJI breakouts than with the 4-year halving cycles, as traditionally believed.
2024: The DJI-Bitcoin Synchronicity Reinforces the Theory
The year 2024 served as a testament to Blockchain Backer’s theory. The DJI scaled new heights on February 23, 2024, reaching an unprecedented 39,282.28 points. Bitcoin, not to be outdone, surged to its all-time high of $73,835 on March 14, 2024, in striking proximity to DJI’s achievement. Moreover, recent events have added another layer of complexity to the debate.

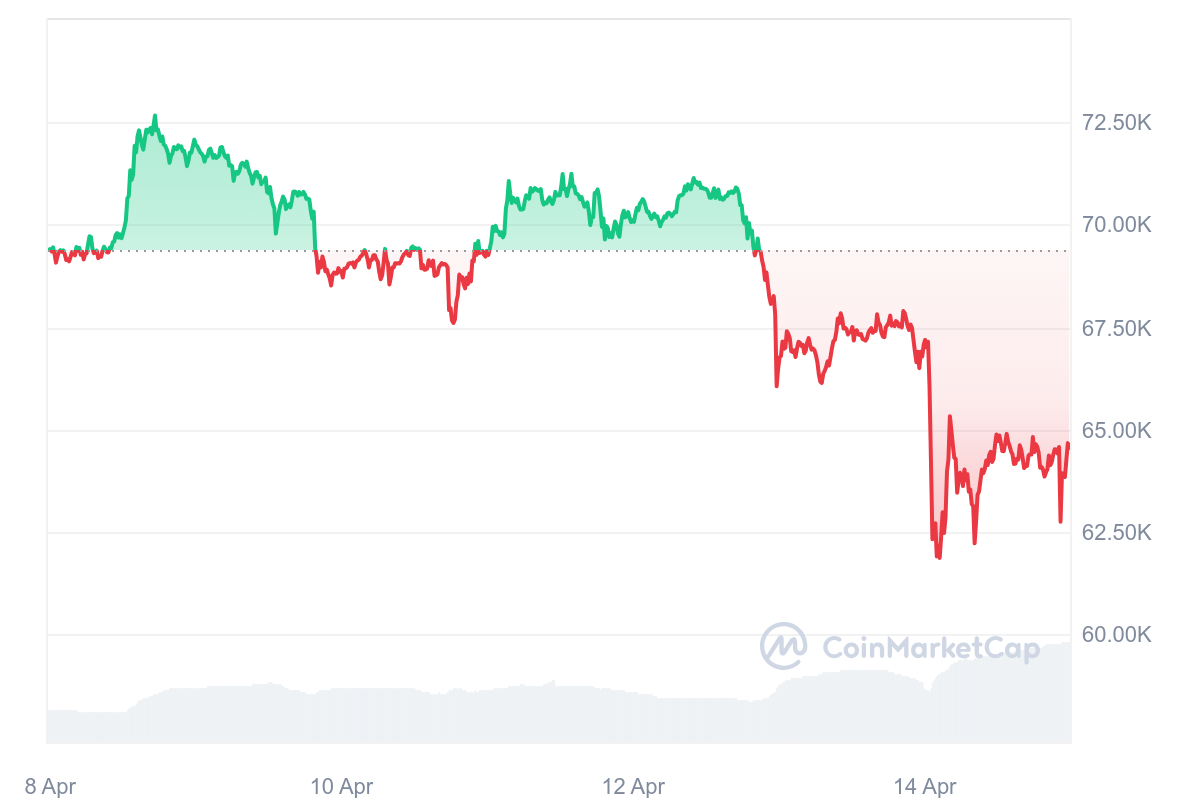
Last Friday witnessed a significant selloff on Wall Street, fueled by escalating concerns over inflation and geopolitical tensions. The DJI plunged by 1.24%, settling at 37,983.24 points. Concurrently, the BTC price experienced a sharp downturn, dropping from approximately $67,000 to a low of $60,908 on Saturday. As of the latest data, Bitcoin is trading at $64,388, reflecting a 3.73% decline over the past 24 hours.
The Final Word
While the debate surrounding Bitcoin’s price determinants continues to rage on, Blockchain Backer’s insights offer a fresh perspective that challenges the traditional 4-year cycle theory. He posits that the BTC price performance may be more intertwined with the broader stock market, particularly the DJI than previously acknowledged.
As the community eagerly awaits Bitcoin’s next halving, expected on April 19, 2024, all eyes will be on the DJI. If historical patterns hold true, a new DJI all-time high could herald another bullish phase for Bitcoin. Whether one subscribes to the 4-year cycle theory or leans toward the DJI connection, the crypto market continues to captivate with its intricate dynamics and unpredictability.


