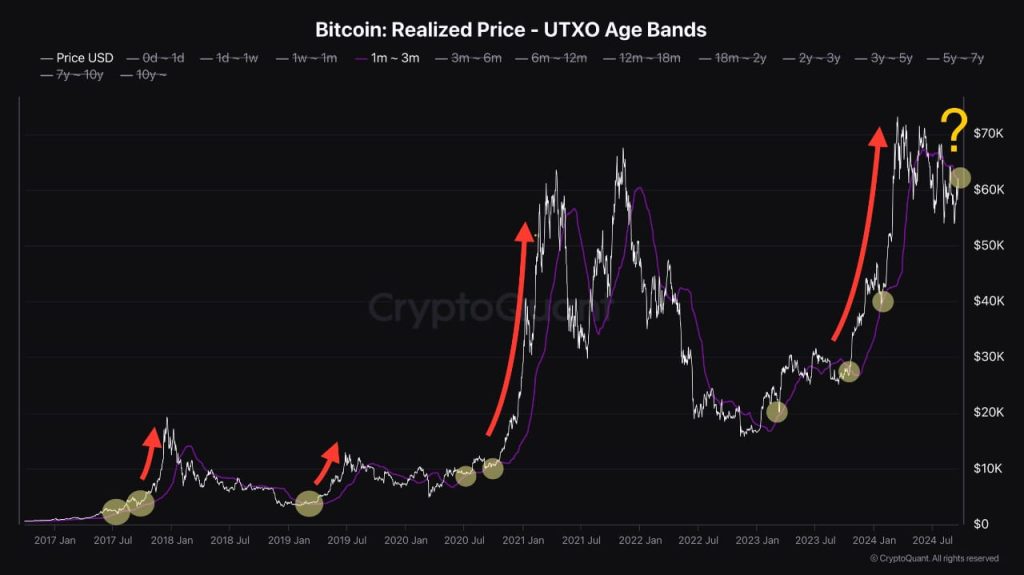
The average buying price of Bitcoin holders who have held for 1-3 months has emerged as a crucial support and resistance level in the market, according to CryptoQuant. This metric is essential for understanding Bitcoin’s price movements, as it consistently influences bullish and bearish trends.
Bitcoin Faces Critical Resistance as It Approaches Average Buy Price
The recent study of the chart reveals two critical zones. The upper one signals BTC price jumping over the average buying price of short-term holders. On the other hand, the lower shows price moving to the area of interest where it bounces back. The significant points in which the price either surged through these levels or faced a high resistance that created pressure downward are marked by yellow circles.

For instance, there is evidence where Bitcoin attained the value of $73k but failed to scale the level of the buy price common among 1-3 months holders. This failure to break through was the beginning of a bearish run, illustrating the significance of this price level to market direction.
Fed Rate Cut Revives Bitcoin Sentiment Among Short-Term Holders
Now, after the U.S. Federal Reserve’s 50-basis point rate cut, Bitcoin is trying to rise above the average purchase price set by short-term holding investors. This rate cut has restored hope in the crypto market and investors are back in the market again. Bitcoin being able to penetrate this crucial resistance level will possibly unlock other upward movement.
The average buy price of these short-term holders is another useful on-chain indicator, as CryptoQuant data. It shows the sentiment of a significant portion of the market and could also predict further price movements. It is essential to grasp their actions since traders and investors will focus on these levels when addressing the constantly evolving world of Bitcoin.


