The transformative potential of blockchain technology is further enhanced by innovative ideas such as chain abstraction and universal accounts.
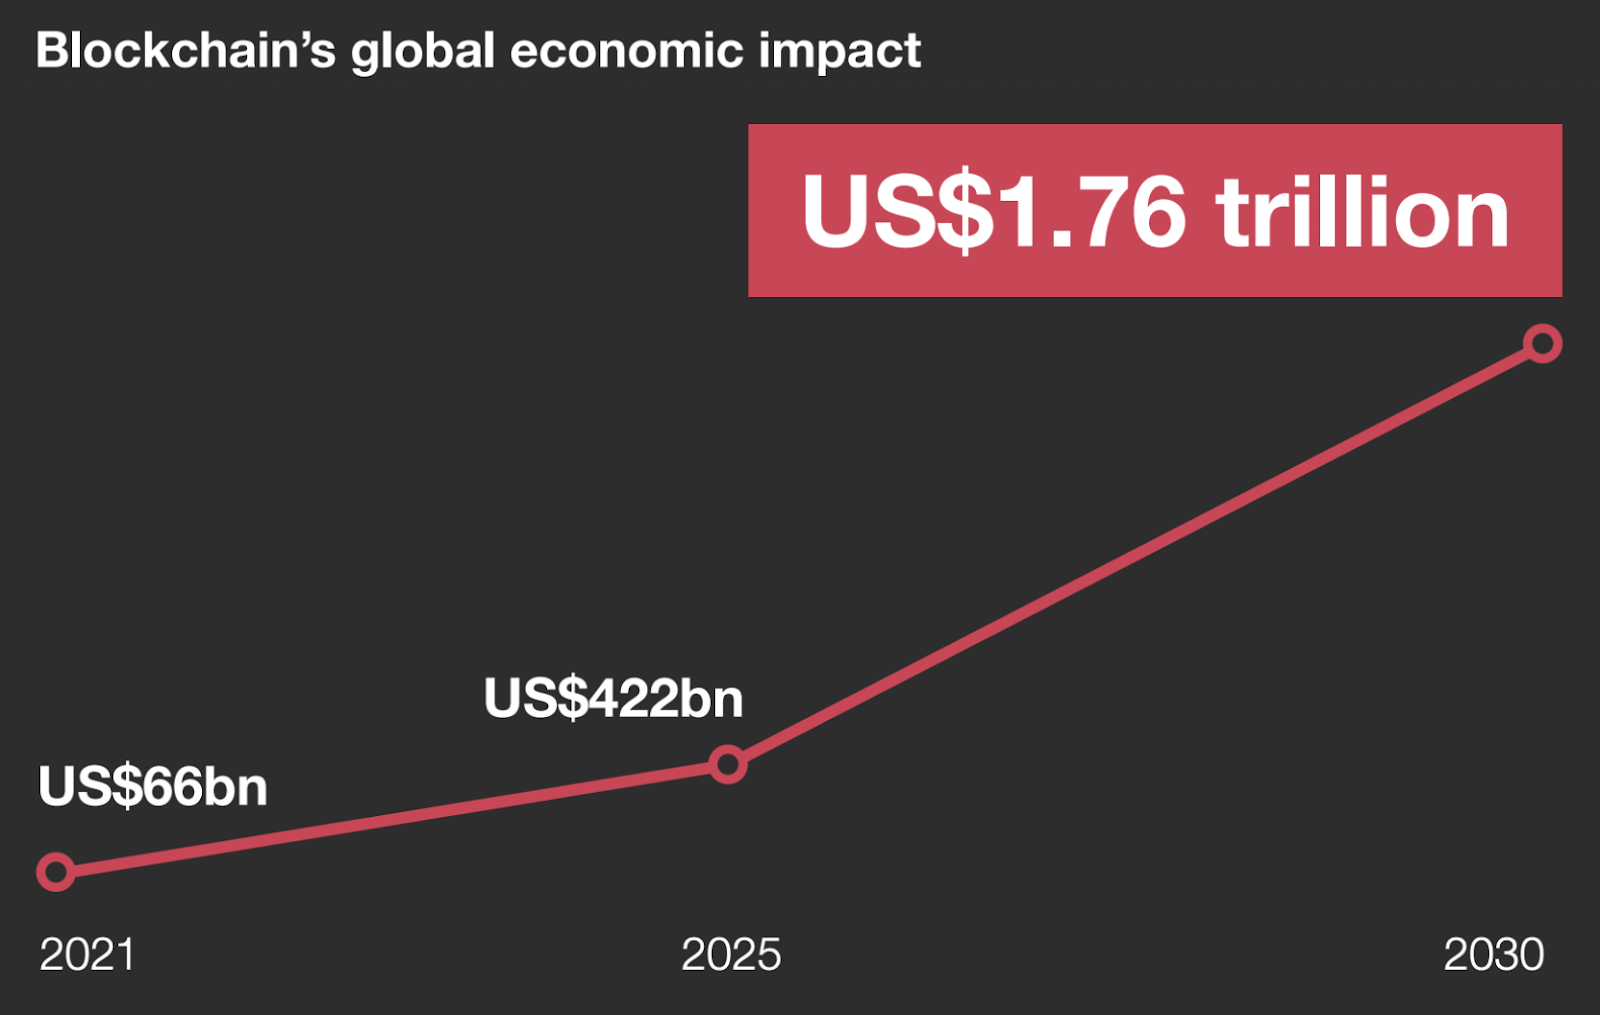
The blockchain sector continues to unfold its potential, shaping the underpinnings of digital transformation across the globe. A report by PwC highlights the transformative potential of blockchain technology and predicts that it will increase global gross domestic product (GDP) by $1.76 trillion by 2030. This surge underscores blockchain technology’s critical role in fostering digital transformation, enhancing security, and ensuring transparency in the business.

Economists expect blockchain to boost global GDP by $1.76 trillion by 2030. Source: PwC
Blockchain also attracts much attention from academia and industry due to its distinctive features, such as data integrity, security, decentralization, and reliability. According to a study by Deloitte, approximately 96% of financial services leaders think blockchain is a technology that will be adopted mainstream.
However, the fact that blockchain adoption rates are still low shows that studies on user satisfaction and adoption are incomplete. A paper addressing this issue points out that in order to unlock blockchain networks’ great potential, the fundamental problems of scalability and interoperability must be achieved.
As the experts emphasize, the quest for seamless integration and interoperability between different chains is a persistent challenge for both developers and end-users. The emergence of varying blockchain networks through innovative projects causes users to have more than one wallet and pay additional fees when making transactions on different networks.
Despite its wonders, the demand for a unified approach to use blockchain technology efficiently and for users to navigate the multi-chain Web3 world seamlessly is growing.
Unpredictable Abstraction Issues
Advancements in wallet and account abstraction (AA) technologies are addressing the challenges faced by Web3 users and developers, such as the proliferation of wallets and the high fees associated with cross-chain transactions.
AA is an idea aimed at simplifying how users interact with blockchain networks. Traditionally, blockchain accounts and transactions have required users to navigate complex processes and understand technical nuances, which can be daunting for the average person. The technology seeks to streamline this experience, making it as easy as managing a social media profile. AA proposes to blend the flexibility of smart contracts with the simplicity of traditional account models, allowing for customizable security measures and easier transaction processes.
Parallel to the concept of account abstraction, wallet abstraction offers an innovative approach to how we manage our digital wallets. Wallet abstraction envisions a future where users can have a single, unified wallet interface that intelligently manages multiple assets across different blockchains. This advanced wallet would not only store your digital currencies but also automatically select the most efficient transaction methods, manage security protocols, and even interact with decentralized applications (dApps) seamlessly.
Despite these advancements, implementing AA comes with its own set of challenges. For instance, AA, particularly as realized through Ethereum’s EIP-4337, promises to improve user experiences by allowing more complex on-chain governance rules and reducing reliance on traditional externally owned accounts (EOAs). However, this flexibility and power come at a cost. Executing complex governance models directly on the blockchain, especially on Ethereum’s Layer-1, can be prohibitively expensive due to limited scalability, leading to high execution costs.
Moreover, while second-layer solutions like rollups and sidechains offer pathways to alleviate scalability issues and reduce fees, they contribute to the fragmentation of the ecosystem. This fragmentation complicates the developer experience and puts additional strain on main chains. Innovations in data availability and scalability aim to address these concerns. However, the evolving landscape of data availability solutions and the competition between various Layer-2 technologies could lead to further complexities.
Chain Abstraction and Universal Accounts
A transformation is needed to unify the Web3 environment, where alternatives such as layer 2 protocols and side chains cannot solve Blockchain’s interoperability problems. Aware that account and wallet abstraction technologies further bottleneck networks, two new ideas emerged: chain abstraction and universal account.
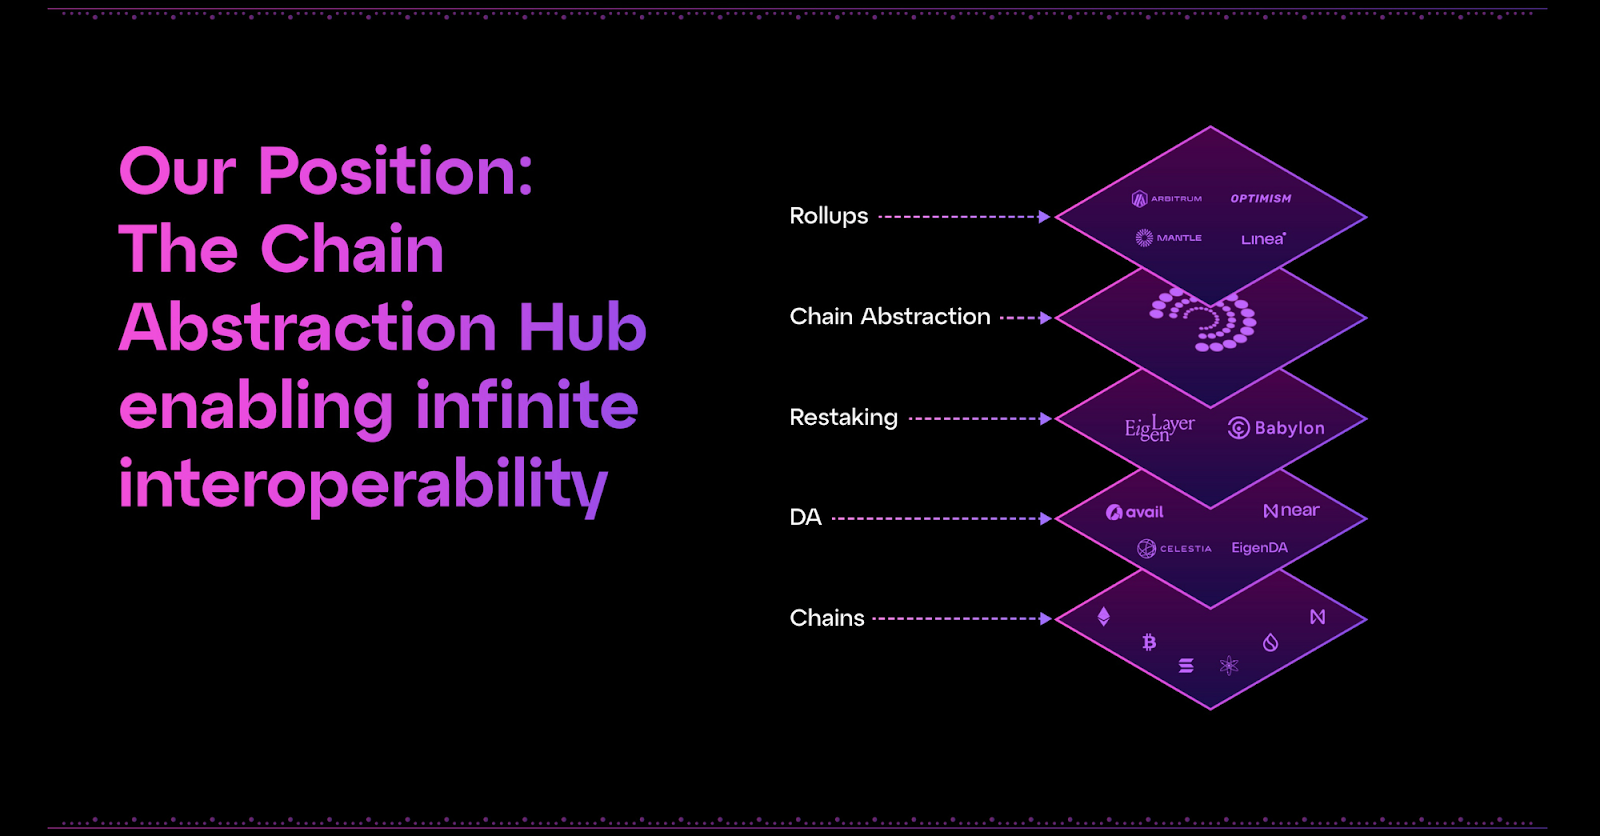
Chain abstraction is a concept within the blockchain and crypto domain that aims to simplify and enhance the interoperability of different networks. Its essence revolves around creating a structure that allows various blockchains to interact more seamlessly or abstract the complexities involved in dealing with different blockchain protocols.

Chain abstraction creates a structure that allows various blockchains to interact more seamlessly.
By abstracting the chains or essentially creating a layer that can interface with multiple blockchains in a unified manner, developers can build applications that are not bound to the specificities of any single blockchain. This could enable more fluid movement of assets, information, and functionality across the ecosystem, potentially leading to new types of applications and use cases that can harness the collective strengths of diverse blockchains.
In the context of blockchain and crypto, universal accounts refer to a conceptual framework through which a single account can seamlessly interact with multiple blockchain networks or services. Thanks to this concept, it is possible to access different blockchain services, conduct transactions, and manage assets without the need to change wallets or interfaces. It significantly simplifies the user experience across Web3 by allowing users to transact across different blockchain platforms with a single online identity or account.
Many initiatives offer innovative approaches to scalability and interoperability problems, which are seen as the Achilles heel of the blockchain ecosystem. Particle Network, which announced its modular layer 1 that powers chain abstraction and universal calculations, is one of them. Through its layer 1 release, Particle aims to solve Web3’s ongoing fragmentation problem, simplifying users’ interactions across multiple blockchains into a unified experience. Built on the Cosmos SDK, Particle Network’s modular blockchain promises a seamless transactional ecosystem across diverse blockchains.
In Conclusion
Advances in chain abstraction and universal accounts, which aim to address critical challenges related to scalability and fragmentation of the blockchain ecosystem, are promising. These innovations not only pave the way for developers to create more fluid and versatile applications but also unlock the potential for countless new use cases that leverage the common capabilities of various blockchains.
The journey towards a unified and accessible Web3 world is full of challenges. Still, the promise of a more integrated and efficient blockchain ecosystem is a compelling vision that moves the community forward.
As we move towards a future marked by enhanced interoperability and simplified user experiences, blockchain’s potential to reshape the digital world is becoming increasingly tangible.


