
*BTC* is facing significant resistance around the $52,000 mark, which may signal an upcoming short-term pullback. The market witnessed a withdrawal of approximately $36 million from Bitcoin-focused exchange-traded funds (ETFs) on February 21, as reported by sources like BitMEX Research. However, this trend reversed on February 22, with the ETFs experiencing net inflows of nearly $251 million.
Market analysts, including the well-known trader and analyst Rekt Capital, suggest that the market might be preparing for a correction ahead of Bitcoin’s halving event in April. Drawing parallels to the bull markets of 2016 and 2020, Rekt Capital speculates that a pattern of a pre-halving dip followed by a post-halving accumulation phase could unfold. The reluctance of Bitcoin to extend its upward trajectory has triggered some investors to cash in profits on certain altcoins. Such corrective actions are deemed beneficial for the market’s long-term stability as they weed out weaker participants, thereby providing opportunities for more committed investors to buy in at lower prices.
What are the key support levels that we should keep an eye on for Ethereum and other leading altcoins? We will dive into the charts of the top 5 cryptocurrencies to discover more.
Ethereum (ETH) Price Analysis
*ETH* attempted to breach the significant $3,000 resistance level but encountered strong opposition from sellers. Though the price declined toward $2,900, it recovered from the low. Currently, ETH price is trading at $2,973, surging over 1.2% from yesterday’s rate.
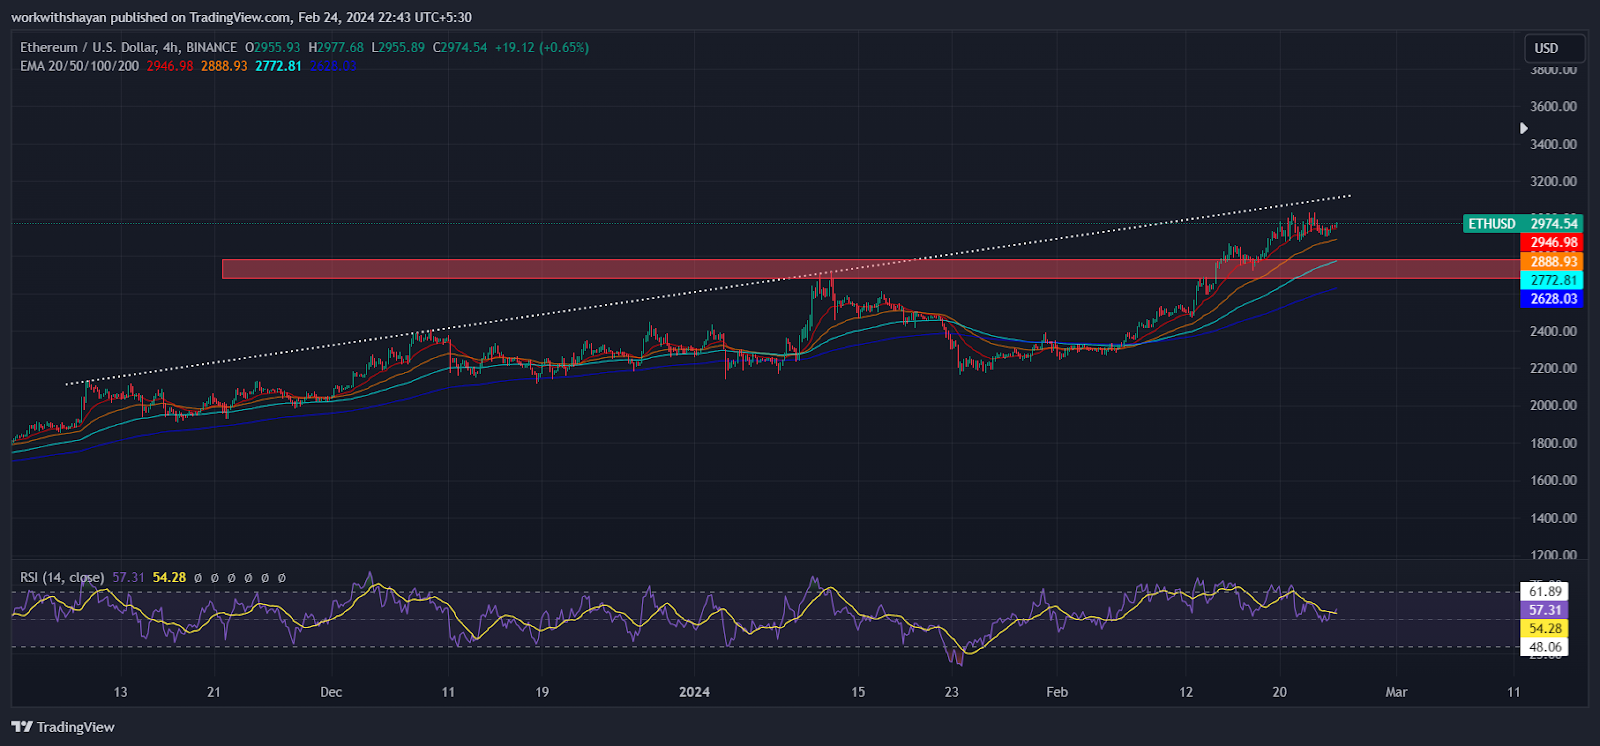
The market is witnessing efforts by sellers to initiate a pullback towards the breakout point of $2,700. This level is crucial, especially since it’s in close proximity to the 100-day Exponential Moving Average (EMA) on the 4-hour price chart.
A vigorous rebound from $2,700 would suggest that the bulls have successfully converted this level into a support zone, setting the stage for another push to overcome the $3,000 barrier. A breakthrough could send the ETH/USDT trading pair towards the $3,100-$3,300 zone.
On the flip side, for the bears to undermine the bullish momentum, they would need to consistently drive and keep the price below $2,700. Should this occur, the pair could potentially fall below moving averages. A decline to such depths might send the ETH price toward $2,400.
SingularityNET (AGIX) Price Analysis
AGIX price continued its upward trend after surpassing the $0.6 resistance, setting its sights on the $1 mark as the next upward milestone. However, bears attempted to hinder progress at $0.85.
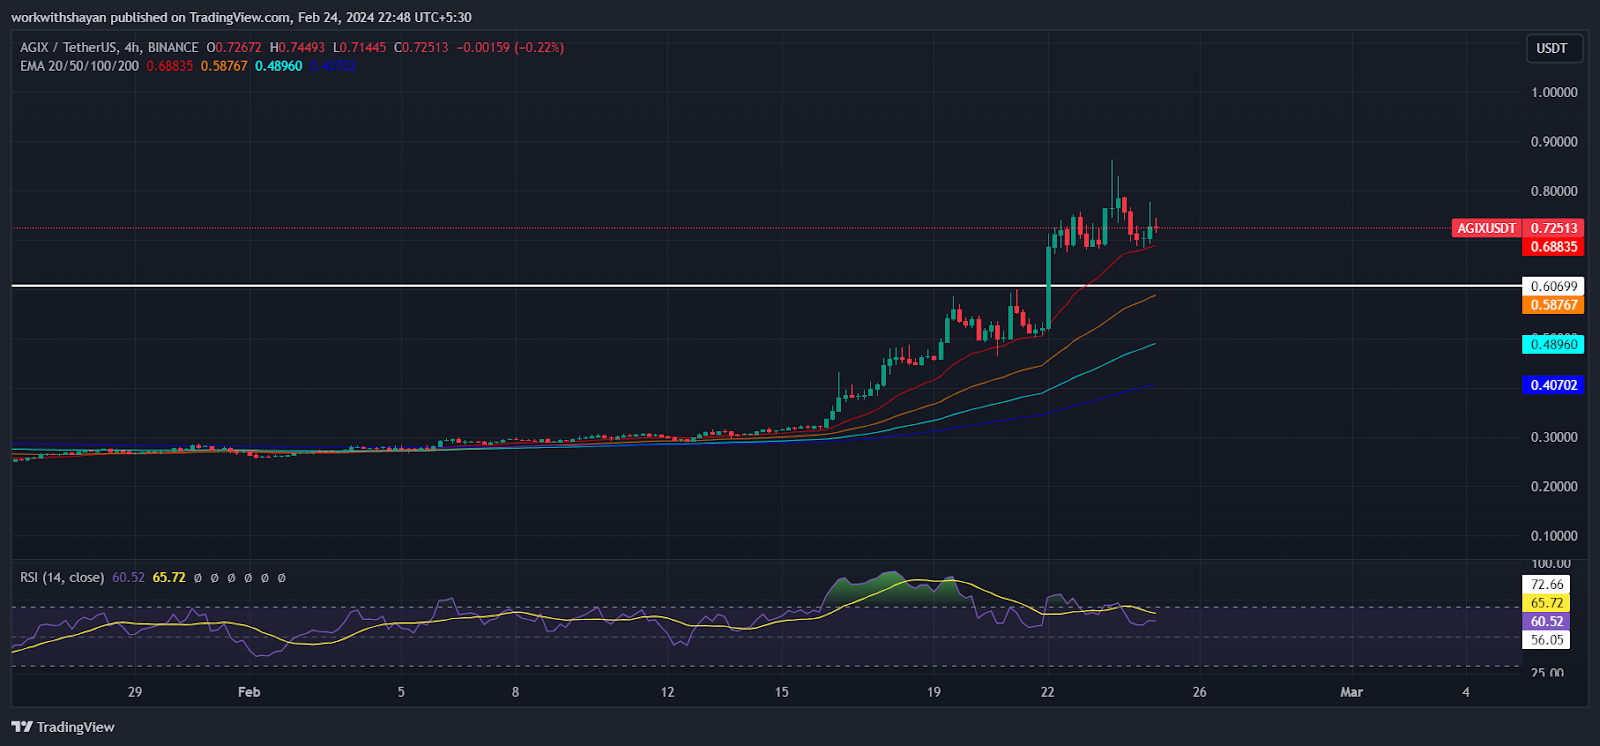
If the bulls manage to hold their position near this level without significant losses, it suggests strong buying interest on minor pullbacks, enhancing the likelihood of an advance to $1.
On the downside, the initial support is found at 20-day Exponential Moving Average (EMA) at $0.68, followed by $0.6. Should these support levels fail to sustain, the correction might extend to the 100-day Exponential Moving Average (SMA) at $0.48. Holding above this crucial threshold is vital for the bulls, as a breach could indicate a shift in the prevailing trend.
Near Protocol (NEAR) Price Analysis
The extended lower shadow of the NEAR candlestick indicates that investors continue to see any drops to the Fib levels as an opportunity to buy. As a result, NEAR price continued breaking above resistance lines and is now nearing the ascending line.
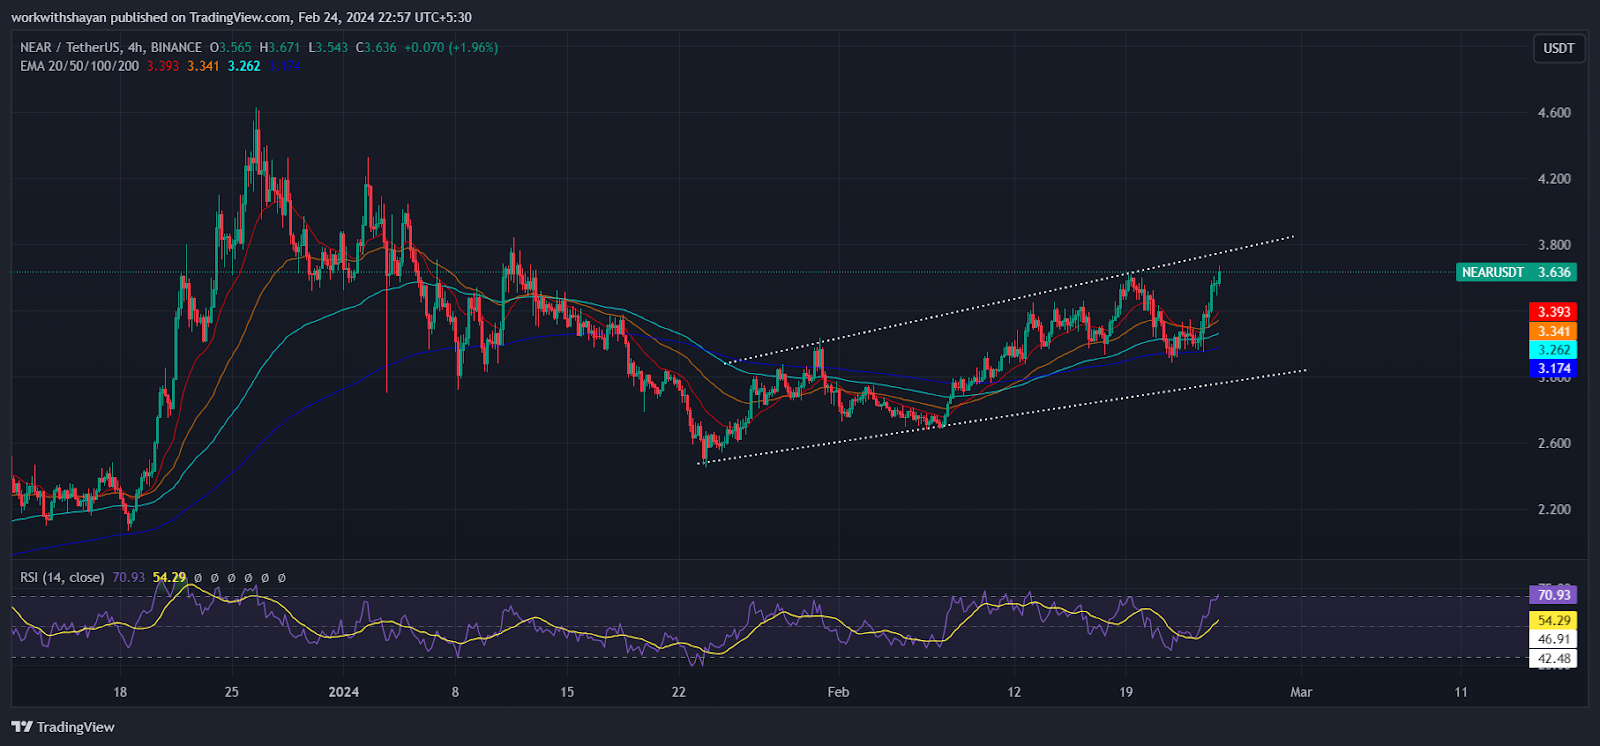
Investors are making efforts to keep the price over the immediate resistance level of $3.8. Should they succeed, the NEAR/USDT trading pair might surge to the crucial resistance point at $4.6. At this juncture, a fierce contest is anticipated between buyers and sellers. However, if the buyers come out on top, the price is likely to climb to $6 next.
Conversely, a sharp decline from $3.8 would show that the sellers are effectively protecting this threshold. A fall below the 20-day EMA would indicate a decline in buying pressure.
Celo Price Analysis
Sellers attempted to push Celo price back within the symmetrical triangle pattern, but buyers aggressively defended the level. As a result, the price jumped above $0.88; however, bears defended that level. As of writing, CELO price trades at $0.825, surging over 5.7% from yesterday’s rate.
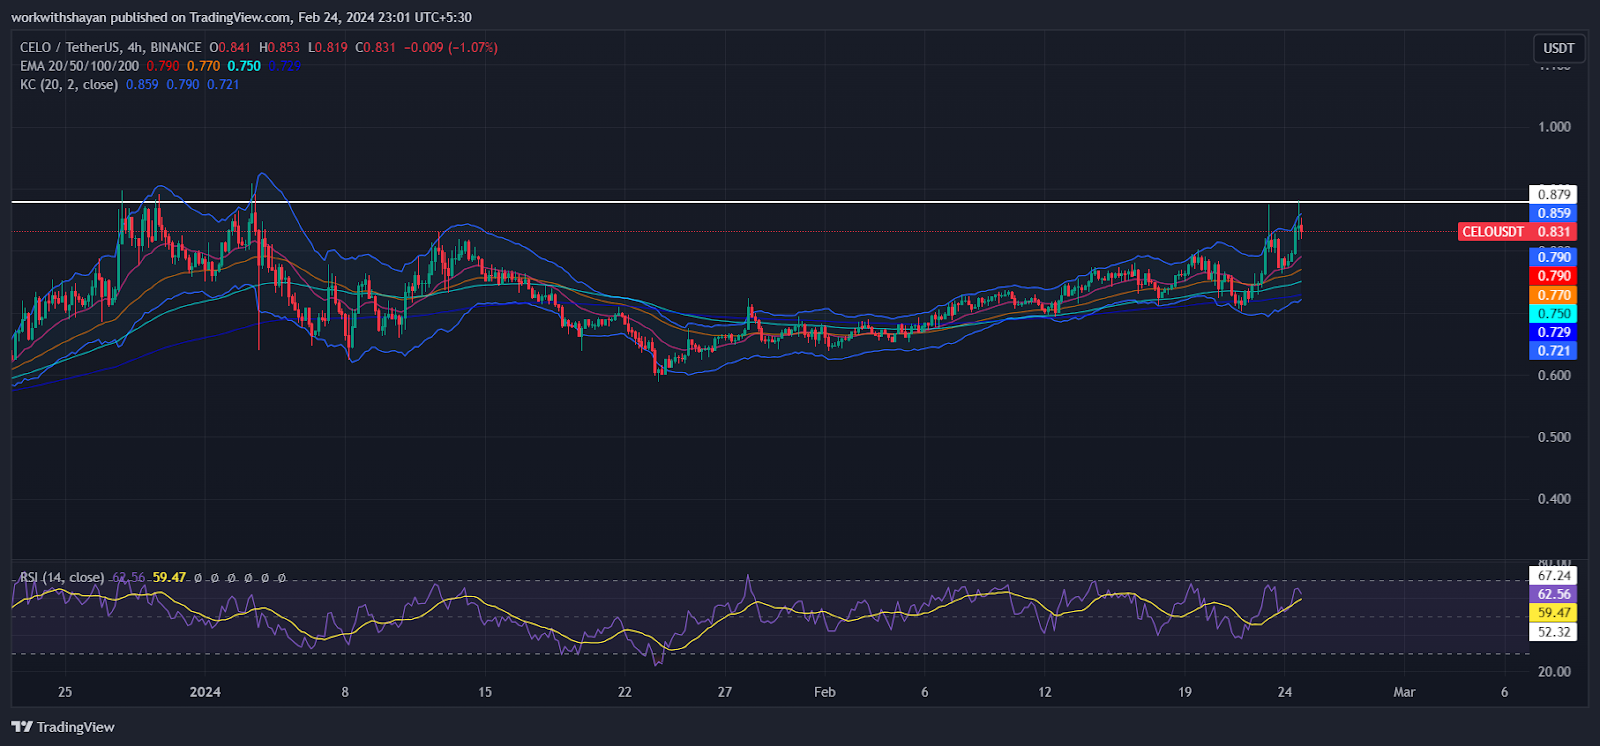
The 20-day Exponential Moving Average (EMA) at $0.79 is showing signs of a gradual increase, and with the Relative Strength Index (RSI) standing above 62, it suggests that buyers are gearing up for a rally. A successful move past the $0.88 mark could send the CELO/USDT pair toward the resistance zone of $0.9 to $1.
However, this bullish scenario could be challenged if the price declines and falls below the moving averages, signaling that sellers are capitalizing on every slight upward movement. A breach below $0.76 could further amplify selling pressure.
Coti Price Analysis
COTI has experienced a slight downturn within an upward trend, indicating that short-term traders might be cashing in their profits. However, buyers are focused on extending the uptrend above $0.18.
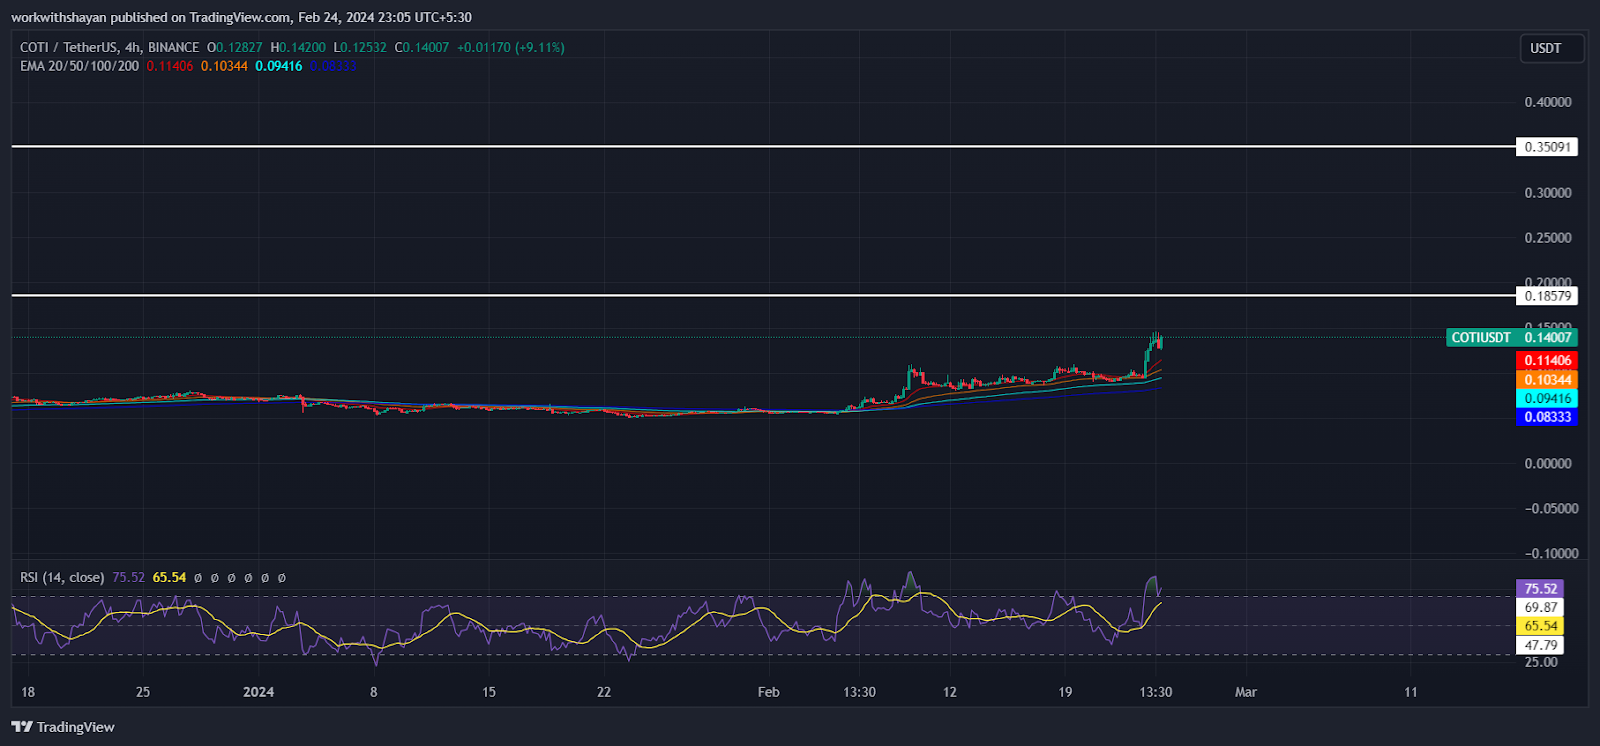
The upward trajectory is supported by a climbing 20-day EMA (at $0.11) and an RSI that is approaching overbought conditions, signaling that the market momentum is still predominantly bullish. A jump in price and a subsequent climb above $0.18 would confirm that the upward trend is continuing. Following this, the COTI/USDT pair might aim for a target of $0.35.
Conversely, should the price decline further and fall below the 20-day EMA, a level that could potentially entice buyers. However, if selling pressure outweighs buying interest, the pair might drop to the consolidated zone of $0.1.


