Ethereum and *BTC* movements have been closely linked for a considerable time. This relationship has fueled hopes that Bitcoin’s recent achievement of the $50,000 mark on February 12 could pave the way for Ethereum to experience a similar bullish trend toward $3,000. In the Ethereum derivatives markets, there’s been a significant uptick in the pace at which speculative traders are engaging in leveraged bullish positions. Additionally, several on-chain indicators have now turned bullish, suggesting a big rally is waiting for *ETH* in the coming days.
Ethereum’s Netflow Touches The Negative Zone
Ethereum’s price dropped below the $2,600 mark after BTC price lost its momentum near $50K following hotter than expected CPI data. On Tuesday, the US Bureau of Labor Statistics (BLS) reported that the annual inflation rate in the US, as measured by the Consumer Price Index (CPI), fell to 3.1% in January from 3.4% in December. However, this rate surpassed market expectations, which had predicted a decrease to 2.9%. Furthermore, the Core CPI, which excludes the volatile prices of food and energy, rose by 3.9% during the same period, matching December’s rise and exceeding analysts’ forecasts of 3.7%.

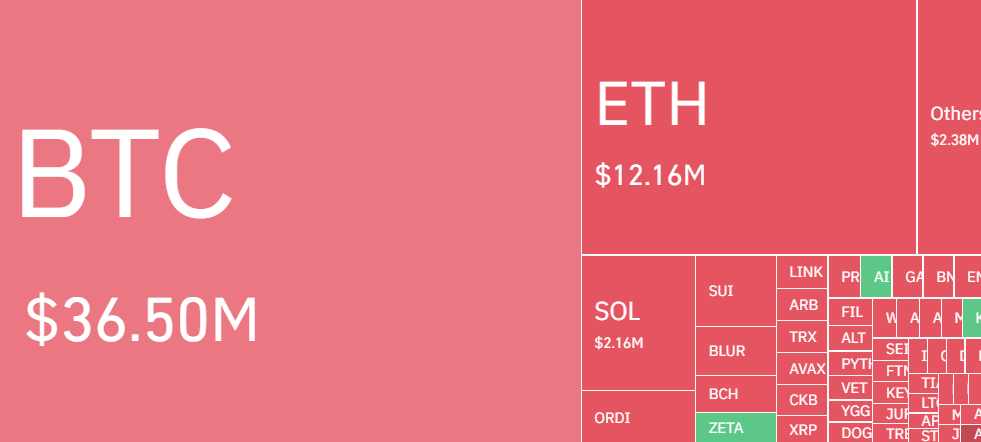
Despite initially reacting negatively to bearish news, the market has rebounded, with Bitcoin’s price now targeting a breakthrough above $52,000 and Ethereum’s price maintaining its position above $2,700. This recovery has triggered a significant wave of liquidations in the past four hours, totaling more than $62 million, with $60 million of those liquidations coming from sellers.
With Ethereum’s price now aggressively climbing above $2,700, there’s a noticeable uptick in investors purchasing more Ethereum, aiming to stockpile in anticipation of additional increases. According to data from IntoTheBlock, the Netflow metric for Ethereum has been on a downward trend and has recently entered the negative territory at -69.95K ETH.

This indicates that the volume of Ethereum being withdrawn from exchanges for holding purposes is exceeding the volume being deposited, highlighting a growing confidence among investors. This shift suggests a potential for further upward movements in Ethereum’s price.
Additionally, the race for spot Ethereum ETF is also heating up. Recently, Franklin Templeton submitted an application for a spot Ethereum exchange-traded fund (ETF), according to a filing with the Securities and Exchange Commission (SEC). This move places the asset manager alongside other prominent firms such as BlackRock, Fidelity, Ark and 21Shares, Grayscale, VanEck, Invesco, Galaxy, and Hashdex, all of which have also filed applications for similar ETFs in recent months.
What’s Next For ETH Price?
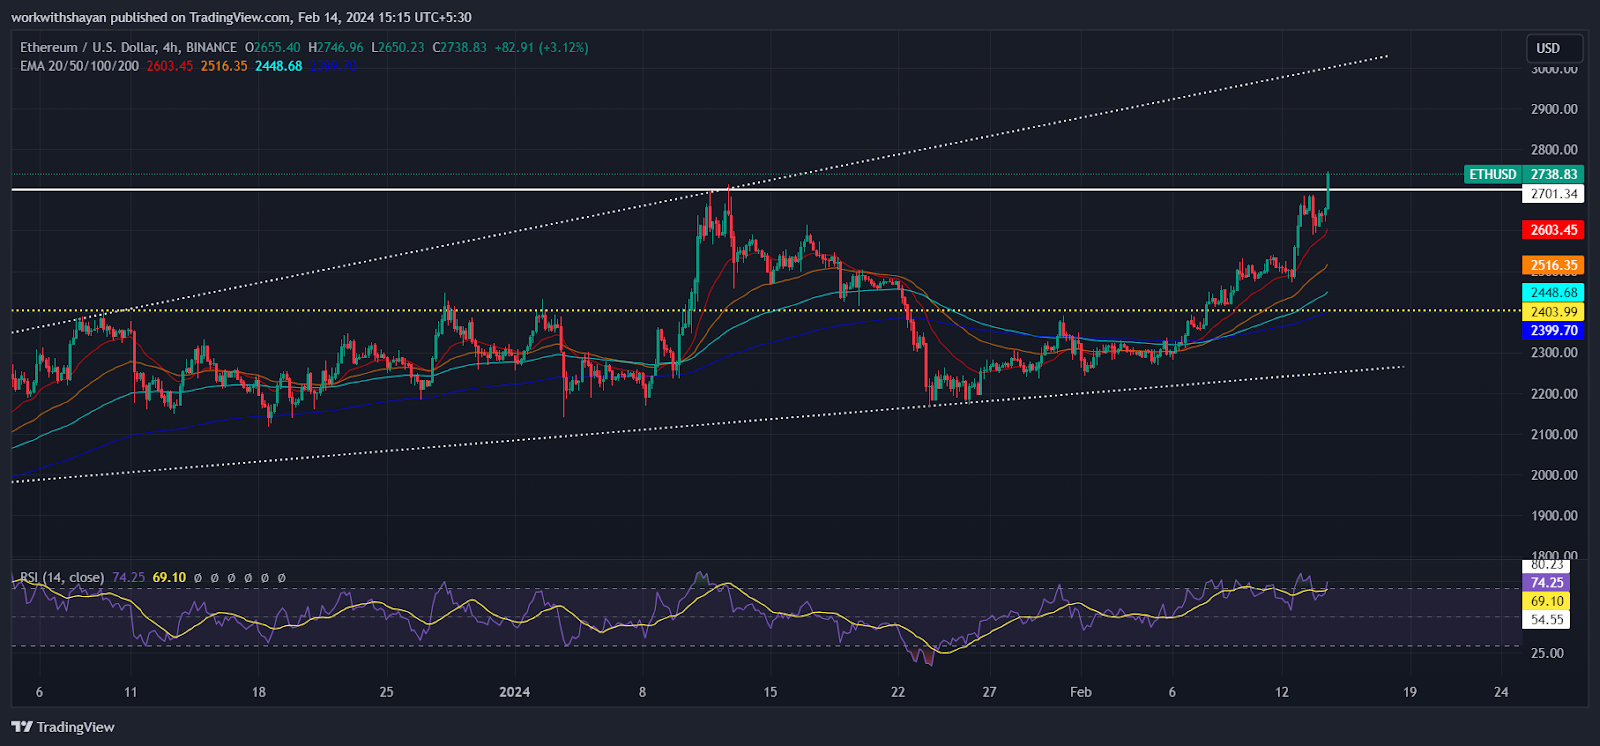
Bears attempted to halt Ether’s recovery around the immediate Fibonacci retracement level at $2,700, but the bulls persisted. ETH price is now pumping hard and it is surging toward $2,750. As of writing, ETH price trades at $2,744, surging over 3% from yesterday’s rate.

The upward trend of the 20-day Exponential Moving Average (EMA) at $2,604 and the Relative Strength Index (RSI) in the overbought territory signal that the bulls are in control. Although there is a concern of a correction from $2,700, holding this barrier could send the ETH/USDT pair towards $3,000.
The crucial support level to monitor on the downside is the breakout level of $2,400. Should this level be breached, selling pressure might intensify, potentially driving the price down to the significant support at $2,200, where buyers are likely to mount a strong defense.

Over the last few minutes, ETH price is facing a surge in long/short ratio as it climbs above 1, currently at 1.4528. This suggests that around 60% of total positions are now anticipating a price increase, while only 40% positions expect a decline in the ETH price chart.


