The overall market sentiment across these cryptocurrencies appears to be bullish, with all the charts showing an uptrend in the last period with the global market cap up 0.55% from its previous 24 hour one to stand at $1.96T as of press time.
Bitcoin Price Review
The Bitcoin price chart shows a bullish trend over the period, with the price moving from around $44,000 to just over $51,800. The Moving Average Convergence Divergence (MACD) indicates a strong bullish momentum as the MACD line (blue) is above the signal line (orange).
However, there’s a recent crossover that suggests a potential slowing down of the bullish momentum on Bitcoin (BTC). The Woodies CCI is hovering around the zero line, indicating that the Bitcoin$84,050.00
Ethereum Price Reveiw
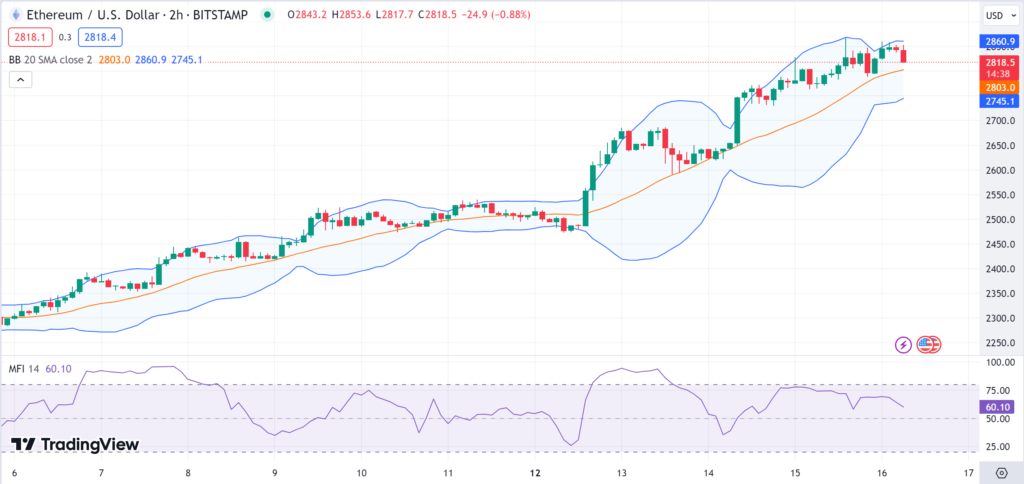
Ethereum’s chart presents a steady uptrend with the Ethereum$1,924.30
The Money Flow Index (MFI) is above 50, which is generally considered bullish, although it has receded from the higher levels, indicating a decrease in buying pressure. The Ethereum price stood at $2823 as of press time representing a 1.9% pump in the last day.

VeChain Price Review
VeChain (VET) shows a strong bullish rally, with the price jumping from around $0.038 to $0.047. The SuperTrend indicator is in a bullish state as the price is above the SuperTrend line. The Average Directional Index (ADX) is quite high, above 70, which indicates a very strong trend.
However, such high levels can also sometimes precede a consolidation or trend reversal due to overextended price movements. The VeChain price stood at $0.48 as of press time representing a 27% pump in the last day as it emerged as the top gainer.
Arweave Price Rebview
The Arweave price has also seen a substantial increase, moving from below $9 to peaks of around $12. The Auto Pitchfork indicator shows the price moving within an upward channel, which is a bullish sign.
The Money Flow Index (MFI) is extremely high, nearing the overbought region at 80.98, which suggests that the Arweave price may be reaching a point where a pullback could occur due to profit-taking. The Arweave price stood at $11.82 as of press time representing a 17% pump in the last day as it emerged as the second top gainer.
Render Price Review
Render Token exhibits a bullish trend with the Render price moving up from around $4.9 to peaks of $5.5. The Alligator indicator, composed of three moving averages, is in a bullish formation with the jaw, teeth, and lips aligned upwards.
The Awesome Oscillator (AO) is positive, indicating bullish buying pressure, but we can see some recent bars shrinking, which might suggest a decrease in the momentum on the Render price action. The Render price stood at $5.4 as of press time representing a 9.3% pump in the last day as it also emerged among the top gainer.


