

Last Updated: November 3, 2026
DefiLlama is a free, open-source DeFi analytics dashboard that tracks total value locked (TVL) across blockchains and protocols, along with fees and revenue, DEX and perpetuals volume, stablecoins, yields, token unlocks and crypto hacks. On November 3, 2026, it showed $81.55 billion locked in decentralized finance, with Ethereum holding about 53% of that total, and its About page says it tracks 9,188 protocols on 602 chains.
DefiLlama launched in 2020 as a TVL tracker and has become a standard reference for one question: how much money is locked in DeFi, and where. It calls itself the largest TVL aggregator for DeFi, says its data is fully open source and shows no ads or sponsored content. New to the sector? Start with our beginner’s guide to DeFi.
Key Takeaways
- TVL: $81.55 billion on November 3, 2026, down about 4% in a week and about 43% from a year earlier, with Ethereum at $43.39 billion (53.2%).
- Coverage: 9,188 protocols on 602 chains, according to DefiLlama’s About page; Lido, Aave and Morpho lead its TVL ranking.
- Beyond TVL: dashboards for fees and revenue, DEX and perps volume, yields, stablecoins, bridges, ETFs, real-world assets, digital asset treasuries, token unlocks, hacks and raises.
- Cost: free, including a public API; DefiLlama Pro costs $49 a month or $490 a year.
- Hacks: Binance’s $6.36 billion theft on October 29, 2026 is now the largest entry in DefiLlama’s hacks database.
DefiLlama Snapshot
Blockchainreporter’s snapshot of DefiLlama data at about 11:00 UTC on November 3, 2026:
| Metric | Value |
|---|---|
| Total DeFi TVL | $81.55 billion (down 1.37% in 24 hours) |
| Stablecoin market cap | $293.74 billion (down 1.83% in 7 days) |
| 24h DEX volume | $6.39 billion |
| 24h perps volume | $26.67 billion (open interest $13.08 billion) |
| 24h fees paid | $65.5 million |
| 24h protocol revenue | $35.73 million |
| 24h bridge volume | $1.67 billion |
| Tokenized RWA active AUM | $30.12 billion |
| Token unlocks, next 30 days | $1.20 billion |
| Total value hacked (all time) | $27.60 billion |
| Protocols tracked | 9,188 (6,912 in the TVL ranking) |
| Chains tracked | 602 |
| Yield pools | 14,039 across 508 protocols on 105 chains |
| Launched | 2020 |
| Cost | Free; Pro $49 a month or $490 a year |
What Are the Current Trends in Crypto TVL?
DeFi TVL has been shrinking. DefiLlama’s daily series puts it about 4% lower than a week earlier, about 12% lower than 30 days earlier and about 27% below its level on January 1, 2026. A year ago, on November 3, 2025, it stood at $144.45 billion, and its 2025 peak was $167.92 billion on October 7. The total has climbed back from a 2026 low of $65.62 billion on July 1, but it remains less than half of the November 2021 record of $177.46 billion.
Because TVL is measured in dollars, falling token prices lower it even when no deposits leave DeFi, so the trend is best read next to prices. Over the same week, Bitcoin fell 3.5% to about $76,897 at 10:40 UTC on November 3, according to CoinMarketCap, and the Crypto Fear and Greed Index fell to 26 (Fear) on November 3 from 37 a day earlier.
Largest DeFi Protocols by TVL
| Rank | Protocol | Type | TVL | 7d change |
|---|---|---|---|---|
| 1 | Lido | Liquid staking | $21.81B | -3.29% |
| 2 | Aave | Lending | $16.27B | -6.70% |
| 3 | Morpho | Lending | $11.09B | -3.02% |
| 4 | Binance staked ETH | Liquid staking | $8.67B | +0.06% |
| 5 | Spark | Lending and savings | $6.66B | -28.14% |
| 6 | JustLend | Lending and TRX staking | $6.45B | -6.00% |
| 7 | EigenCloud (formerly EigenLayer) | Restaking | $5.74B | -4.28% |
| 8 | Sky | CDP lending | $5.14B | -5.97% |
| 9 | Ethena | Synthetic dollar (USDe) | $4.99B | -1.68% |
| 10 | ether.fi | Liquid staking | $4.71B | -12.45% |
Source: DefiLlama protocol rankings, default settings. Liquid staking appears in the ranking but is subtracted from the headline TVL by default.
What Does DefiLlama Do?
At its core, DefiLlama reads on-chain data through open-source adapters to calculate TVL, standardized across protocols and chains rather than self-reported, which is why it is widely cited as a neutral reference. Its products include the following.
DefiLlama Analytics Dashboards
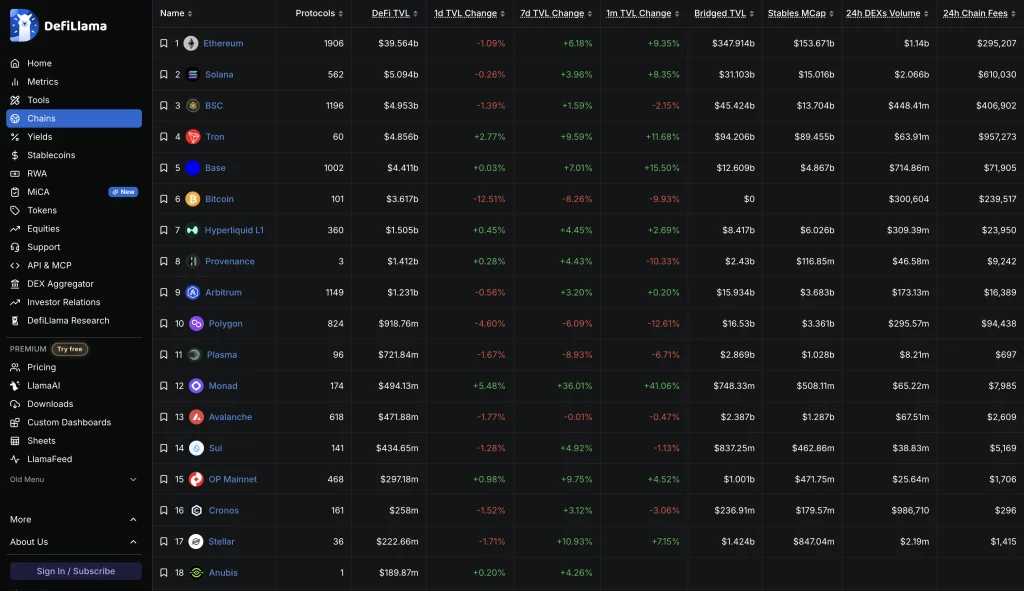
- Chains: ranks blockchains by DeFi TVL, with protocol counts, bridged TVL, stablecoin supply, DEX volume, chain fees and active addresses.
- Fees and Revenue: ranks protocols by what users pay and by revenue, which DefiLlama defines as the subset of fees a protocol retains. Tether led with $16.8 million in 24-hour fees on November 3, ahead of Circle ($6.7 million) and Hyperliquid’s perps exchange ($3.1 million).
- DEXs and Perps: $6.39 billion in 24-hour spot DEX volume, led by Uniswap ($1.81 billion), and $26.67 billion in perpetual futures volume on venues such as Hyperliquid, Aster and Lighter.
- Yields: 14,039 pools. The largest are liquid staking tokens: Lido’s stETH (about $22.0 billion, 2.28% APY) and Binance’s WBETH (about $8.2 billion, 2.20%). Our yield farming guide explains where such returns come from.
- Stablecoins: supply and peg data for more than 400 stablecoins, led by Tether (USDT) at $178.48 billion, a 60.76% share, and USD Coin (USDC) at about $71.1 billion.
- Bridges: $1.67 billion in 24-hour volume, led by Circle ($581.7 million) and LayerZero ($472.1 million).
Market, Risk and Funding Data
- ETFs: daily spot crypto ETF flows, using Farside data. Spot Bitcoin ETFs had net outflows of $398.6 million on November 2, 2026, and Solana ETF flows are counted from October 28, 2025.
- RWA: tokenized treasuries, private credit, real estate and commodities, with $30.12 billion in active assets under management.
- Digital Asset Treasuries: public companies holding crypto, led by Strategy (849,327 BTC) and, among Ethereum holders, BitMine Immersion Technologies (6,028,946 ETH).
- Token Unlocks: vesting schedules for 371 protocols, with $1.20 billion due over the next 30 days. See what a token unlock is and why it can move prices.
- Hacks: 1,336 exploits and $27.60 billion in losses. The largest entry is now the Binance hack of October 29, 2026 ($6.36 billion), ahead of the LuBian mining pool theft ($3.5 billion, December 2020) and the Bybit exploit ($1.4 billion, February 2025).
- Raises: 7,349 funding rounds worth $149.85 billion.
DefiLlama Tools: LlamaSwap, LlamaAI and the API
- LlamaSwap: DefiLlama’s DEX aggregator, which it describes as charging no fees.
- LlamaAI: answers plain-language questions using DefiLlama’s dataset; free users get one question a day.
- API and MCP: free public endpoints documented at api-docs.defillama.com, plus paid premium endpoints and an MCP server for AI agents.
How to Use DefiLlama
No account is needed for the basics. These steps cover the most common tasks:
- Start on the overview. The homepage shows total TVL, stablecoin market cap, DEX and perps volume and the protocol ranking; the chain selector filters it by network.
- Find a protocol’s TVL. Search for the protocol and open its page, which shows TVL, “TVL by Chain”, fees and revenue, treasury and unlock data, plus a methodology note.
- Check what is included. The “Include in TVL” menu adds or removes governance-token staking, pool2, active loans, double-counted deposits, liquid staking and vesting.
- Compare chains. On Chains, sort networks by DeFi TVL, 1-day, 7-day or 30-day change, stablecoin supply, DEX volume or fees, or narrow the list to EVM chains or rollups.
- Check yields. On Yields, filter pools by token, protocol or chain and compare APY with TVL. Note how much of the APY comes from token rewards, which can fall quickly.
- Read fees and revenue. Fees show what users paid; Revenue shows what the protocol kept. Check each definition first: a stablecoin issuer’s fees are yields on its reserve assets, not trading fees.
- Export or automate. Pro subscribers can download CSV files, and developers can pull the same data through the free API.
Top Blockchains by TVL
As of November 3, 2026, Ethereum remains the dominant chain by total value locked, with more than seven times the TVL of any rival. Base ranks second at $5.90 billion, narrowly ahead of Solana, BSC and Tron, which each hold between $5.1 billion and $5.4 billion. Hyperliquid L1 was the only top-10 chain whose DeFi TVL rose over the past week.
| Chain | DeFi TVL | Share of DeFi TVL | 7d change | Protocols |
|---|---|---|---|---|
| Ethereum (ETH) | $43.39B | 53.2% | -4.84% | 2,118 |
| Base | $5.90B | 7.2% | -2.15% | 1,217 |
| Solana (SOL) | $5.36B | 6.6% | -5.05% | 712 |
| BSC | $5.16B | 6.3% | -6.09% | 1,255 |
| Tron (TRX) | $5.12B | 6.3% | -5.79% | 81 |
| Bitcoin (BTC) | $4.08B | 5.0% | -4.76% | 118 |
| Hyperliquid L1 | $2.56B | 3.1% | +6.66% | 584 |
| Arbitrum | $1.44B | 1.8% | -3.98% | 1,253 |
Figures change constantly with market prices and on-chain activity; check DefiLlama’s chain rankings for real-time numbers.
Why Does TVL Differ Between Blockchains?
TVL counts assets deposited in a chain’s DeFi protocols, not all the crypto held on that chain, so it depends on which apps a network hosts. Ethereum’s lead comes from the largest lending markets: Aave alone held $13.49 billion of its TVL there. Tron shows the gap clearly. It carries $94.57 billion of stablecoins, according to DefiLlama, but only $5.12 billion of DeFi TVL across 81 protocols, because stablecoins sitting in wallets or on exchanges are not counted as TVL.
Is DefiLlama Free to Use?
Yes. The core dashboards, rankings, yields, stablecoin data, token unlocks, raises and public API are free, and the free plan needs no card. DefiLlama Pro costs $49 a month or $490 a year (about $40.83 a month), with a seven-day trial, and adds LlamaAI research reports, custom dashboards, DefiLlama Sheets, CSV downloads and verified APY data. The API plan adds premium endpoints, 1,000 requests per minute and 1 million calls a month ($0.60 per 1,000 extra calls) plus MCP access; Enterprise pricing is custom. University students can request free Pro and API access.
Is DefiLlama Reliable?
DefiLlama has built its reputation on methodology transparency. Each protocol’s TVL comes from an open-source adapter in its public GitHub repository, where anyone can propose or review a calculation, while volume and fee adapters live in a separate repository. Protocol pages also carry a methodology note; Aave’s defines TVL as the total value of all coins held in the protocol’s smart contracts.
That transparency makes its methodology choices visible. Restaking is the clearest case: ETH staked through Lido and then restaked through EigenLayer, now listed as EigenCloud, would be counted twice if both deposits were simply added. DefiLlama’s “Include in TVL” settings handle this. By default, liquid staking and deposits that flow into another protocol (the “Double Count” toggle) are subtracted from the headline figure, so Lido tops the ranking at $21.81 billion even though its deposits sit outside the $81.55 billion total.
TVL also has limits on any tracker: looped deposits can inflate it, it does not necessarily reflect real economic activity, and it moves with token prices, not only with capital flows.
DefiLlama’s governance has also faced scrutiny. In March 2023, developers including the pseudonymous 0xngmi announced a fork at llama.fi over a planned token they opposed, and Llama Corp, DefiLlama’s parent company, said they had acted on their own, The Block and Cointelegraph reported. A day later, DefiLlama said it was not planning a token and apologized, The Block reported, and the platform still operates at defillama.com.
DefiLlama vs. Token Terminal, Dune and Other Crypto Analytics Tools
Blockchainreporter’s comparison of the main crypto analytics tools, based on each provider’s own website in November 2026:
| Tool | Best for | How it works | Cost |
|---|---|---|---|
| DefiLlama | TVL, fees, yields, stablecoins and hacks across hundreds of chains | Open-source adapters feed standardized public dashboards | Free; Pro $49 a month; API plan |
| Token Terminal | Financial metrics such as revenue, expenses and earnings | Standardized financial and usage metrics in income-statement form, with SQL, API and MCP access | Free tier; paid plans |
| Dune | Custom questions no ready-made dashboard answers | Web-based SQL editor and dashboard builder over indexed blockchain data | Community tier; paid performance tiers |
In short, DefiLlama compares protocols and chains on the same basis, Token Terminal treats crypto projects like listed companies and Dune answers custom questions in SQL, while CoinGecko and CoinMarketCap focus on token prices rather than on-chain deposits.
Several rival dashboards have closed. DappRadar, launched in 2018, announced in November 2025 that it was shutting down because running the platform had become financially unsustainable, Cointelegraph reported, and Zapper said in July 2026 that it would wind down on August 3, according to The Block.
Frequently Asked Questions
What is DefiLlama?
DefiLlama is a free, open-source DeFi analytics dashboard that tracks total value locked across blockchains and protocols, plus fees, revenue, DEX and perpetuals volume, stablecoins, yields, hacks and token unlocks. On November 3, 2026, it reported $81.55 billion in DeFi TVL. Its About page says it tracks 9,188 protocols on 602 chains with no ads or sponsored content.
What is TVL in crypto?
TVL, or total value locked, is the dollar value of crypto deposited in a DeFi protocol’s smart contracts, such as assets supplied to a lending market or tokens in a liquidity pool. Added up across protocols, it shows how much capital DeFi holds: $81.55 billion on November 3, 2026, according to DefiLlama. It moves with both deposits and token prices.
How is TVL calculated, and why does it matter to investors?
DefiLlama calculates TVL by reading the token balances held in each protocol’s smart contracts and valuing them at current market prices, using open-source adapters. Investors watch TVL as a rough gauge of how much capital and trust a protocol or chain attracts, often next to its fees, revenue and market value. A high TVL alone does not make a protocol safe or profitable.
What is DefiLlama used for?
Researchers, investors, developers and journalists use DefiLlama to see where money sits in DeFi and how it moves. Common uses include comparing chains by TVL, checking a protocol’s fees and revenue, finding yield pools, tracking stablecoin supply, watching token unlocks and reviewing past hacks, with every protocol measured by the same published methods.
Is DefiLlama free?
Yes. The dashboards, rankings, yields, stablecoin data and public API are free, and the free plan needs no card. DefiLlama Pro costs $49 a month or $490 a year, with a seven-day trial, and adds LlamaAI research reports, custom dashboards, CSV downloads and spreadsheet integration. A separate API plan adds premium endpoints and higher rate limits.
How accurate is DefiLlama’s TVL data?
DefiLlama reads TVL from on-chain data through open-source adapters and publishes methodology notes on its protocol pages, so its figures can be checked. TVL still has limits: it moves with token prices, can be inflated by looped deposits and depends on choices such as whether liquid staking or double-counted deposits are included, which DefiLlama lets users switch on or off.
Which blockchain has the highest TVL right now?
Ethereum, by a wide margin. On November 3, 2026, DefiLlama showed $43.39 billion of DeFi TVL on Ethereum, about 53% of the $81.55 billion total and more than seven times the next chain. Base ranked second at $5.90 billion, followed by Solana, BSC and Tron, each holding between $5.1 billion and $5.4 billion.
Who created DefiLlama?
DefiLlama launched in 2020 as a TVL tracker. Its best-known developer is the pseudonymous 0xngmi, and The Block has named Charlie Watkins and Ben Hauser as co-founders. DefiLlama is part of Llama Corp, which says its data, infrastructure, payments and media products are used by more than 10 million people a month.
Does DefiLlama have an API?
Yes. DefiLlama offers free public API endpoints for data such as TVL, stablecoins, yields, volumes and fees. The paid API plan adds premium endpoints, including prices, inflows and token unlocks, plus 1,000 requests per minute, 1 million calls a month and an MCP server for AI agents. DefiLlama says its yields API moves to new endpoints on November 13, 2026.
What is the difference between fees and revenue on DefiLlama?
Fees are what users pay to use a protocol, such as swap fees or borrowing interest. Revenue is the part of those fees the protocol keeps after paying liquidity providers, lenders or other parties. On November 3, 2026, DefiLlama tracked $65.5 million in 24-hour fees and $35.73 million in revenue, so protocols kept a little more than half.
What is the biggest crypto hack recorded on DefiLlama?
The largest entry in DefiLlama’s hacks database is now the Binance theft of October 29, 2026, logged at $6.36 billion. It overtook the LuBian mining pool theft of December 2020 ($3.5 billion) and the Bybit exploit of February 2025 ($1.4 billion). DefiLlama counts $8.78 billion lost across 328 incidents in 2026 so far, against $2.72 billion in all of 2025.
This article is for informational purposes only and is not investment advice.
Data sources: DefiLlama dashboards, About and subscription pages and public API (about 11:00 to 11:20 UTC, November 3, 2026), CoinMarketCap, Alternative.me, Token Terminal, Dune, GitHub, The Block and Cointelegraph. Shares, changes and the 2025 hacks total are our calculations from DefiLlama data.