


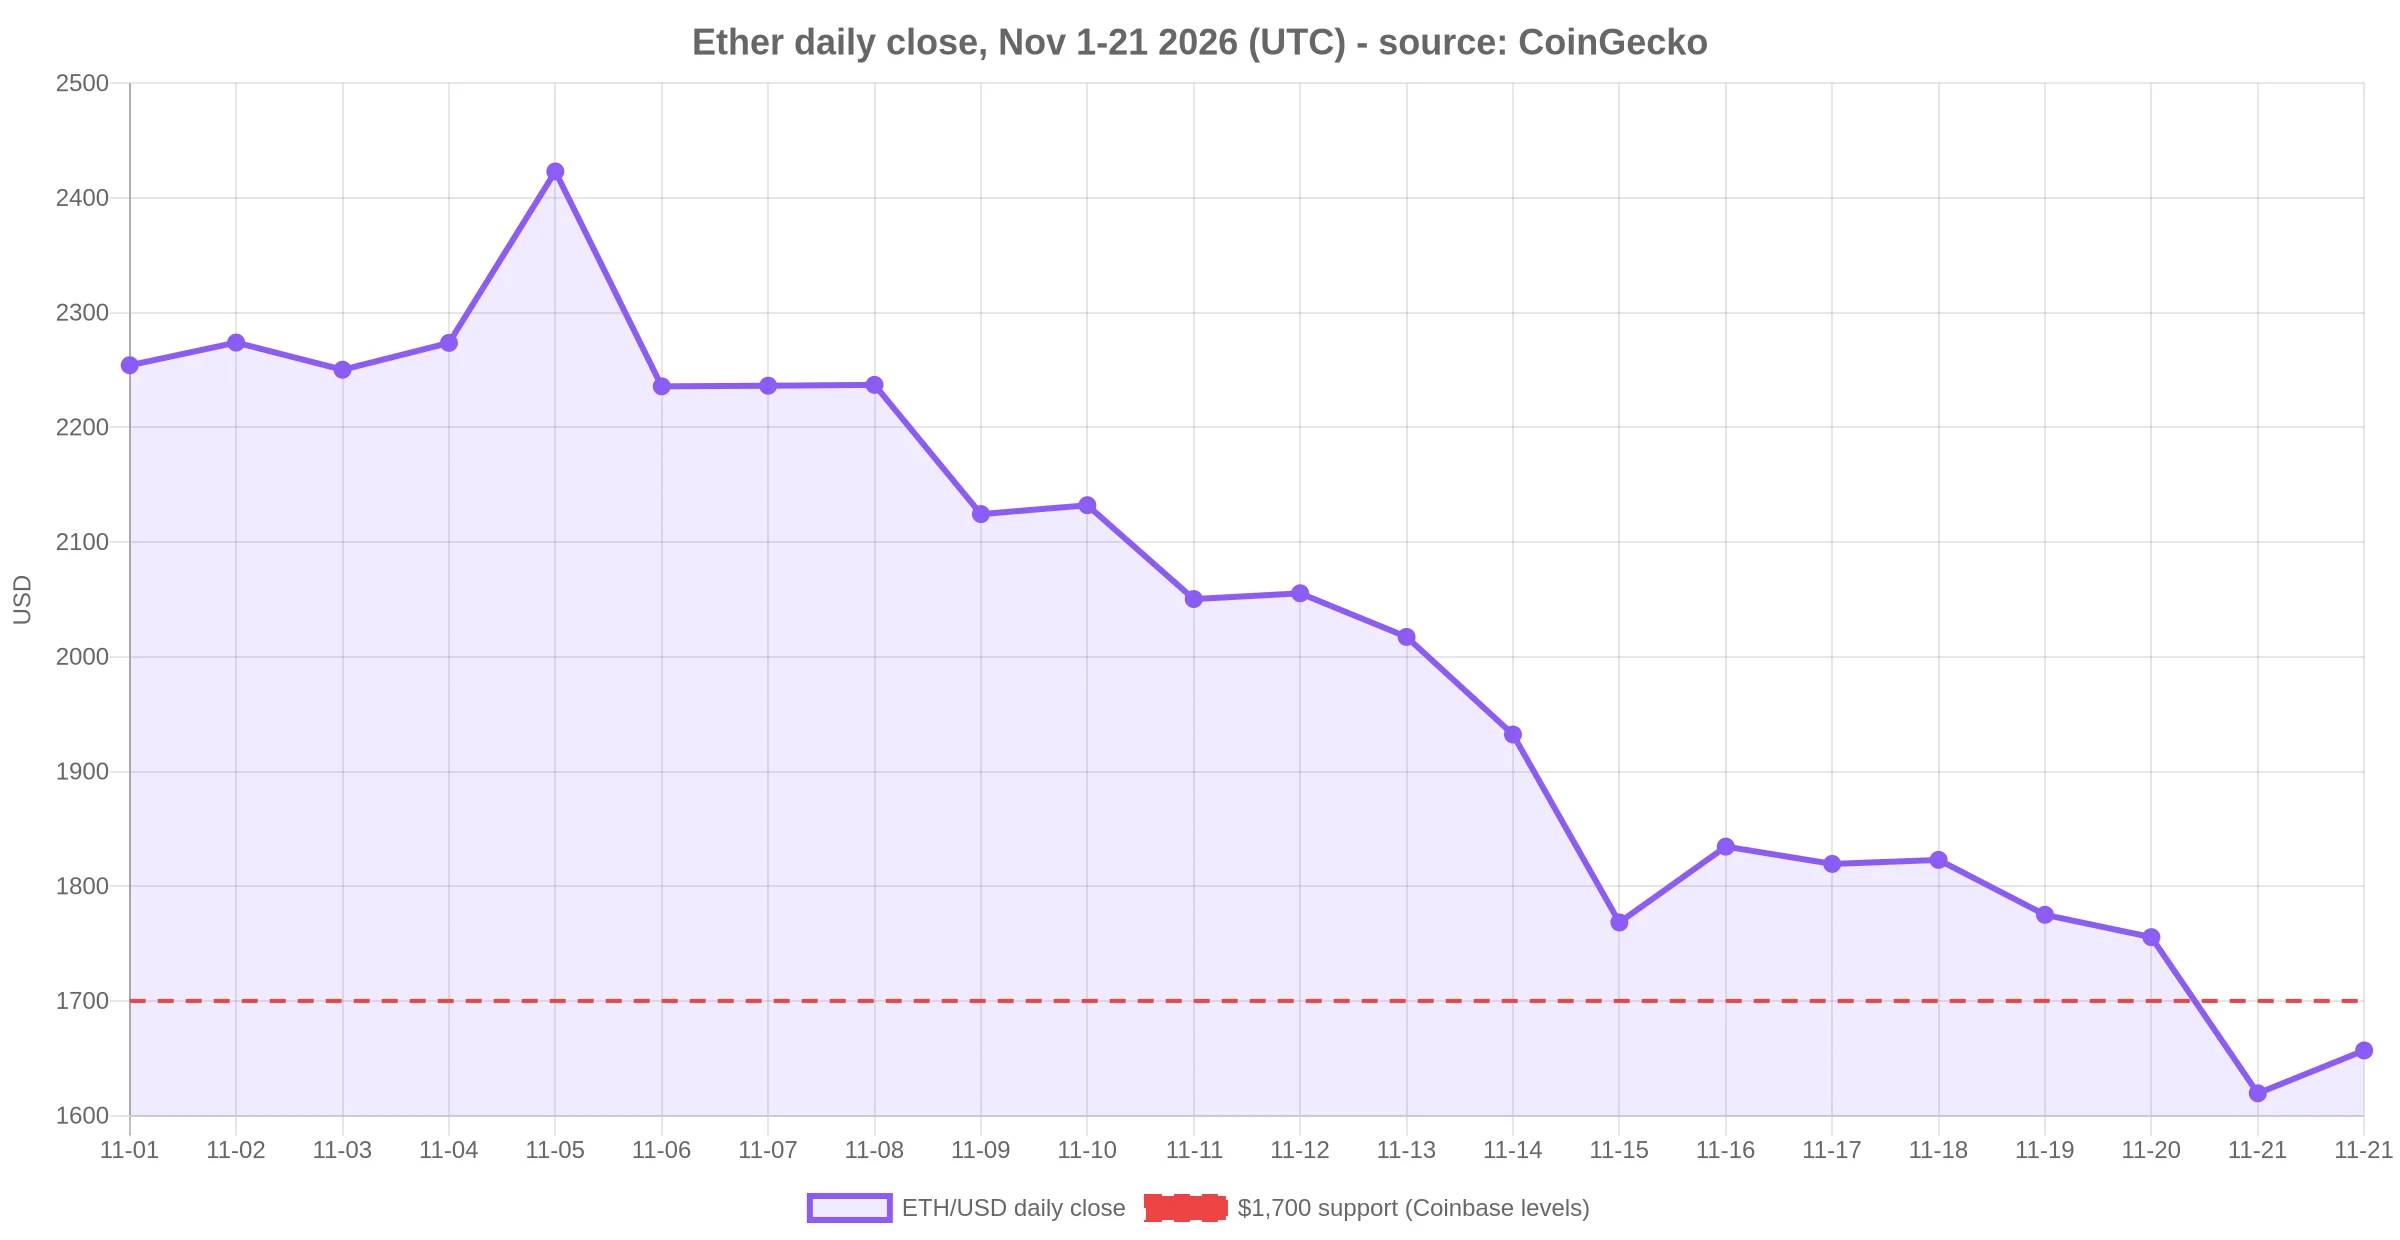
At 12:26 UTC on November 21, ether traded at $1,656.67, down 4.72% in a day and 31.6% below the $2,423.08 it closed at on November 5. The number that matters now sits 43 dollars above the price: $1,700, the higher of two support levels Coinbase Institutional put its name to in a note published the day before. The scenario line in that note is short. “Lose $1700: favors reversion toward $1520.”
The order in which things broke is the part worth following. The price went through the floor first. Then the policy premise that had carried crypto positioning since the midterms lost its timetable, when the same desk wrote on November 13 that election results had weakened the chances of a market-structure bill this year. Then the buyer of last resort stayed away, with spot bitcoin ETFs recording outflows in 11 of 13 sessions through November 18. Each step took away something a dip buyer had been counting on, which is why the entry question now runs through levels rather than narratives.
For a reader weighing a position at this price, the numbers are narrow. Ether sits 8.2% above the next support at $1,520 and 12.3% below the first level that would repair the chart at $1,860.
What the $1,700 Break Actually Changed
Coinbase’s ether levels on November 20 were $1,520 and $1,700 as support, with resistance at $1,860, $1,950 and $2,150. At $1,656.67 the market capitalisation is $202.4 billion, or 9.98% of the $2.03 trillion total. With supply near current levels, every $100 on the ether price is worth roughly $12.2 billion of market value, so the gap between spot and $1,860 is a $25 billion question rather than a rounding error.
The distances matter for position sizing as much as for chart reading. A stop below $1,520 from here risks 8.2%, while a move to $1,860 returns 12.3% and one to $1,950 returns 17.8%. Those numbers come from the November 20 note. They were written before a session in which the whole market fell 7.4%, and they have not been recalculated for it.
The Policy Side of the Equation
The backdrop in the same note is not a crypto story. The 10-year real yield traded near an 18-year high, the minutes of the October 27-28 FOMC meeting showed almost all participants expecting further increases, and the New York Fed’s survey of market participants raised its longer-run fed funds estimate to about 3.4%. Futures imply roughly 67 basis points of hikes over the next 12 months, well under the 225 basis points the Fed delivered between June and November 2022.
Coinbase’s summary of the cross-asset result was equally direct: “Over the past month, only the US dollar gained among a variety of diverse assets, and crypto ranked last.” Its explanation for that pattern was an unwind of the trade that had carried bitcoin, gold and industrial metals together earlier in the year: “We think this is an unwind of the ‘debasement trade’ across all three assets, with real yields likely to matter most at least until the December 8-9 FOMC meeting.”
Legislation has stopped helping too. In its November 13 note the same desk wrote that midterm results had weakened the prospects for crypto market-structure legislation this year. A bill that has not passed cannot function as a catalyst, and positions built around a 2026 legislative window now have to be carried by flows rather than headlines. The October FOMC minutes made the rate side of that problem explicit: two members voted for a hike immediately, and the rest saw more tightening ahead.
Ether Against Bitcoin: A Ratio That Has Not Broken
In dollars, ether is down 31.6% in sixteen days. In bitcoin it has barely moved. The pair trades at 0.02837 BTC, against 0.028 when BlockchainReporter last reviewed the ratio on November 17, when ether changed hands near $1,803. Holding bitcoin constant at $58,389, $1,700 equals 0.02912 and $1,520 equals 0.02604. In ratio terms the two levels sit about 11% apart, while the dollar price has travelled 31.6% in sixteen days.
That stability cuts both ways. It supports the view that this has been a dollar and rates event rather than an ether-specific one, since the token kept pace with bitcoin through a month in which the total market cap fell 7.4% in a single session. It also means ether offers little diversification inside a crypto book. When the dollar is the only winner among 14 tracked assets over 30 days, rotating from bitcoin into ether keeps the same exposure to the thing that is falling.
The Supply Side Has Not Turned
Flows explain more than levels here. US spot bitcoin ETFs lost $2.9 billion in November, with outflows on 11 of 13 trading days through November 18, and Coinbase notes the price is now more than 20% below ETF holders’ average cost basis near $81.2K. Its conclusion on that channel: “we think dip buying through that channel will stay limited.”
Long-term holders, defined in the note as wallets holding for more than 155 days, are selling at a loss on average, with their SOPR below 1, and their combined supply fell by 131,000 BTC over 30 days. Miners are not offsetting it either. MARA sold about $1.1 billion of bitcoin across six weeks, and one digital asset treasury company bought only 485 BTC in the week to November 15 while spending $228 million on preferred-share buybacks. Coinbase’s reading is that “corporate buyers are not absorbing that supply either.”
Realized losses over the past week were the largest since early June and still only about half the February peak, which is why the note expects scope for one more flush before sellers are exhausted. Speculative positioning, by contrast, has already thinned: futures open interest posted its largest seven-day drop since February after roughly $2 billion of liquidations the previous weekend.
What Is Still Holding Up
Cross-asset moves over 24 hours at 12:26 UTC put the weakest large caps at the bottom and a few payment and infrastructure tokens near the top. TRX fell 1.10% to $0.3027 on a $28.8 billion cap, SOL fell 2.89% to $69.08, LINK fell 2.94% to $8.48, ether fell 4.72%, bitcoin fell 5.11% to $58,389, ZEC fell 5.77% to $769.44, HYPE fell 5.86% to $59.60 and BNB fell 6.26% to $532.43.
The spread between the best and worst of those eight is 5.16 percentage points, and bitcoin sits in the middle of the range rather than at the bottom of it. That ordering matters for the rotation argument: the tokens that held up are the ones with transaction revenue or settlement volume tied to stablecoin activity, not the ones with the loudest 2026 narratives.
The Arithmetic Behind a Double
A double from $1,656.67 is $3,313.34. It would add $202.4 billion of market value, equal to 17.2% of bitcoin’s entire $1.17 trillion. To retake its November 5 close of $2,423.08, ether needs 46.3%, and to reach the $2,150 resistance in the note it needs 29.8%.
Those are the numbers a buyer is underwriting when the thesis is “ether is cheap because it fell.” They also explain why the level ladder matters more than the entry price: at 9.98% of total market value, ether cannot re-rate on its own cash flows while the dollar and real yields are doing the work, and the same note’s bitcoin framework, a $68K close needed to repair the trend, caps how far a beta trade can run in the meantime.
What Would Change the Read
Coinbase’s bitcoin markers are specific. A close back above $68,000 would put the 200-week average and a dense band of pivot resistance behind the market. A sustained break below $58,000 would bring the realized price near $53,500 into view, with $48,000 to $51,000 behind it where the 2022 analogs overlap the lower liquidation cluster. Neither has happened yet, and the December 8-9 FOMC meeting sits less than three weeks away as the dated event that resolves the macro half.
For ether, two closes settle the argument. A reclaim of $1,860 puts the first resistance from the November 20 note back in play and would mark the $1,700 break as a failed breakdown. A close under $1,520 confirms the note’s own scenario and shifts attention to where the 2022 analog levels sit for bitcoin, since the ratio implies ether would follow rather than lead.
Data: CoinGecko, Coinbase Institutional, Federal Reserve.
Frequently Asked Questions
Is ether a buy below $1,700?
The price alone does not answer that. Ether broke the $1,700 support that Coinbase Institutional listed on November 20, and the next level in that note is $1,520. A buyer at $1,656.67 is 8.2% above that support and 12.3% below the first resistance at $1,860, so the risk and the reward are both defined by levels the market has not yet tested.
What is the next support level for ETH?
$1,520, according to Coinbase’s November 20 levels. The note’s ether scenarios read: hold above $1,860 favors a retest of $1,950 and then $2,150, a rejection at $1,950 favors a return to $1,860, and losing $1,700 favors a move toward $1,520.
Why is ether falling while bitcoin falls less?
Ether’s 4.72% drop against bitcoin’s 5.11% over 24 hours means it actually fell slightly less in percentage terms. The ETH/BTC ratio at 0.02837 is close to the 0.028 recorded on November 17, so the move has been broad rather than ether-specific. The shared driver in Coinbase’s account is a rising 10-year real yield near an 18-year high and futures pricing further Fed hikes.
What would signal that the selloff is over?
Two things, in order. For the complex, a bitcoin close back above $68,000 would clear the 200-week average and the pivot-resistance band Coinbase maps there. For ether, a close above $1,860 would invalidate the $1,700 breakdown. The dated test for both is the December 8-9 FOMC meeting, since real yields have driven the correlation for the past month.
Are ETF outflows still driving the price?
They are contributing. US spot bitcoin ETFs lost $2.9 billion in November with outflows on 11 of 13 trading days through November 18, and Coinbase estimates the average ETF holder’s cost basis near $81.2K, which leaves the fund cohort more than 20% underwater and limits dip buying through that channel.
This article is market analysis, not investment advice. Price levels are taken from Coinbase Institutional’s November 20 commentary and CoinGecko data at 12:26 UTC on November 21, 2026.
About the author
Samuel is a professional cryptocurrency writer specializing in blockchain technology and market analysis. He delivers in-depth insights into emerging trends and developments, producing well-researched, engaging content that makes complex crypto topics accessible to both newcomers and experienced industry professionals. Through his analytical approach and clear writing style, Samuel provides valuable perspectives on the evolving digital asset landscape, establishing himself as a credible and trusted voice in the cryptocurrency industry.