Bulls are showing great dominance on the markets as seen from the global market cap which has gone up by 4.2% to stand at $1.94 as of press time. The trading volume has also dumped by 31% within the same period to $96B.
Bitcoin Price Review
Analysing 2-hour BTC/USD charts, we see a recent uptrend with the Bitcoin$102,484.00
The Price Percentage Oscillator (PPO) is above the zero line, which also confirms bullish momentum. The Bitcoin price stood at $51.8K, representing a 3.8% pump in the last 24 hours. The trading volume has also seen jumped by 21% within the same period to $44 billion.
Ethereum Price Review
Looking at 2-hour Ethereum (ETH/USD) charts, we notice the Ethereum$3,884.37
The Average Directional Index (ADX) is above 50, signaling a strong trend. The Ethereum price stood at $2,783, representing a 4.5% pump in the last 24 hours. The trading volume has also seen a 50% increase within the same period to $24.6 billion.
Stacks Price Review
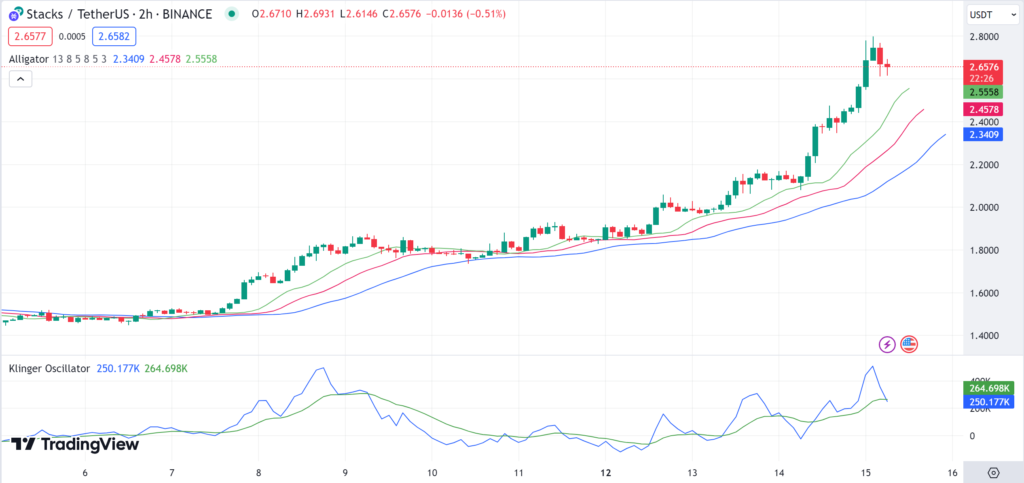
Again looking at 2-hour Stacks (STX/USD)charts, we notice a steady uptrend with the price above all three lines of the Alligator indicator, which is a bullish sign for the Stacks price. The Klinger Oscillator has a positive divergence, reinforcing the bullish outlook. This chart suggests that the uptrend is well-established.
The Stacks price stood at $2.64, representing a 23.9% pump in the last 24 hours. The trading volume has also doubled within the same period to $795 million.

SEI Price Review
On the other hand, analysing SEI (SEI/USD) charts, we see that the SEI price action is bullish, with recent ‘green’ candles indicating buying momentum. The Money Flow Index (MFI) is high, above 80, which typically suggests overbought conditions but can also indicate strong buying interest.
The Volume Oscillator is negative, suggesting a divergence where price is increasing despite lower volume, which could be a cautionary signal on the SEI price. The SEI price stood at $0.888, representing a 12.3% pump in the last 24 hours. The trading volume has also doubled within the same period to $869 million.
Bitget Token Price Review
Lastly, analysing 2-hour Bitget Token (BGB/USD) charts, We see a very strong uptrend with the Bitget Token price creating consecutive ‘green’ candles well above the Alligator indicator lines. The ADX is over 50, signifying a very strong trend. However, investors should be cautious as such steep uptrends can sometimes lead to sharp corrections if the momentum reverses.
The Bitget Token price now stands at $0.779, representing a 10.4% pump in the last 24 hours. The trading volume has also jumped by a slight 4% within the same period to $24.4 million.


